- Expression tracks
- Gene-level expression
- Transcript-level expression
- Additional information to GE or TE tracks
- RNA-Seq reads track
RNA-Seq result handling
Clicking Next will allow you to specify the output options as shown in figure 31.41.
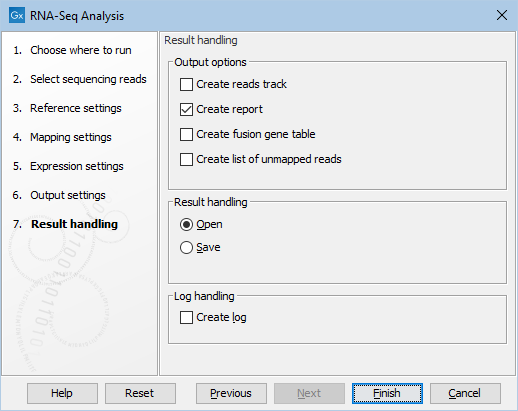
Figure 31.44: Selecting the output of the RNA-Seq analysis.
The main results of the RNA-Seq analysis are Expression Tracks. A track with a name ending with (GE) summarizes expression at the gene level. If the "Genome annotated with genes and transcripts" option was selected, a second track, with a name ending in (TE), is produced, which summarizes expression at the transcript level.
In addition, other results can be generated using the following options:
- Create reads track. This track contains the mapping of the reads to the references. This track has a name ending with (Reads).
- Create report. See RNA-Seq report for a description of the information contained in the report. This report is the only place results of the spike-in controls will be available.
- Create fusion gene table. This option is enabled when using paired data, and will create a table that lists potential fusion genes (see Gene fusion reporting).
- Create list of unmapped reads. This list is made of reads that did not map to the reference at all, or that were non-specific matches with more placements than specified (see Defining mapping options for RNA-Seq). If you started with paired reads, then more than one list of unmapped reads may be produced: paired reads are put in a list with a name that ends in (paired) while single reads, including members of broken pairs, are put in a read list with a name than ends in (single).
Expression tracks
Both tracks can be shown in a Table (![]() ) and a Graphical (
) and a Graphical (![]() ) view.
) view.
The expression track table view has the following options (figure 31.42).
- The "Filter to selection" only displays pre-selected rows in the table.
- The "Create track from Selection" will create a Track using selected rows.
- The "Select Genes in Other Views" button finds and selects the currently selected genes and transcripts in all other open expression track table views.
- The "Copy Gene Names to Clipboard" button copies the currently selected gene names to the clipboard.
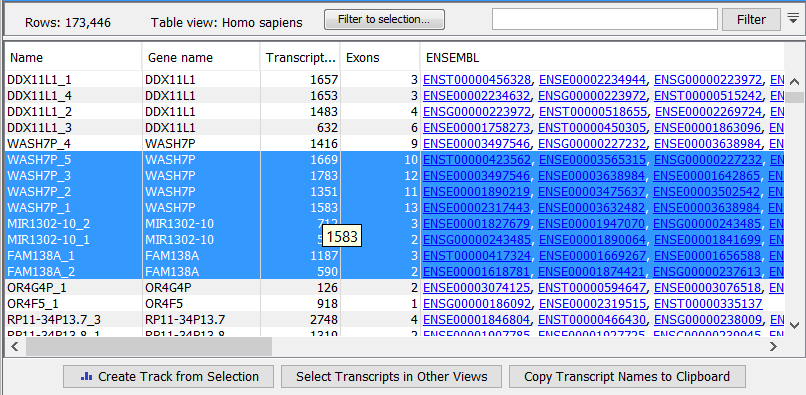
Figure 31.45: RNA-Seq results shown in a table view.
By creating a Track list, the graphical view can be shown together with the read mapping track and tracks from other samples:
File | New | Track List (![]() )
)
Select the mapping and expression tracks of the samples you wish to visualize together and select the annotation tracks used as reference for the RNA-Seq and click Finish.
Once the track list is shown, double-click the label of the expression track to show it in a table view.
Clicking a row in the table makes the track list view jump to that location, allowing for quick inspection of interesting parts of the RNA-Seq read mapping (see an example in figure 31.43).
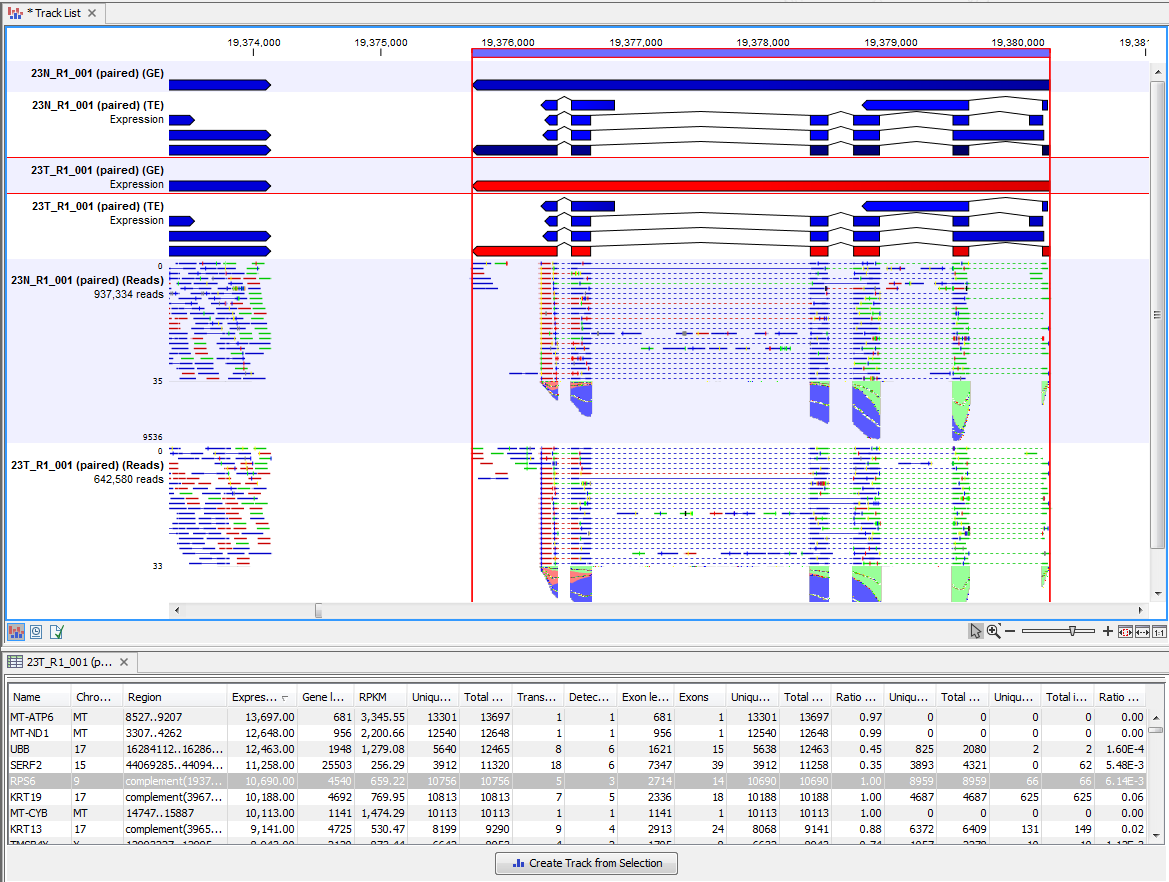
Figure 31.46: RNA-Seq results shown in a split view with an expression track at the bottom and a track list with read mappings of two samples at the top.
Reads spanning two exons are shown with a dashed line between each end as shown in figure 31.43, and the thin solid line represents the connection between two reads in a pair.
When doing comparative analysis, double click on one of the Expression or Statistical Comparison tracks in a track list to get its table view. Then click on the "Select genes in other views" button in any other table or expression browser will cause the track list to zoom to the selected gene.
Expression tracks can also be used to annotate variants using the Annotate with Overlap Information tool. Select the variant track as input and annotate with the expression track. For variants inside genes or transcripts, information will be added about expression (counts, expression value etc) from the gene or transcript in the expression track. Read more about the annotation tool in Annotate with Overlap Information.
Gene-level expression
The gene-level expression track (GE) holds information about counts and expression values for each gene. It can be opened in a Table view (
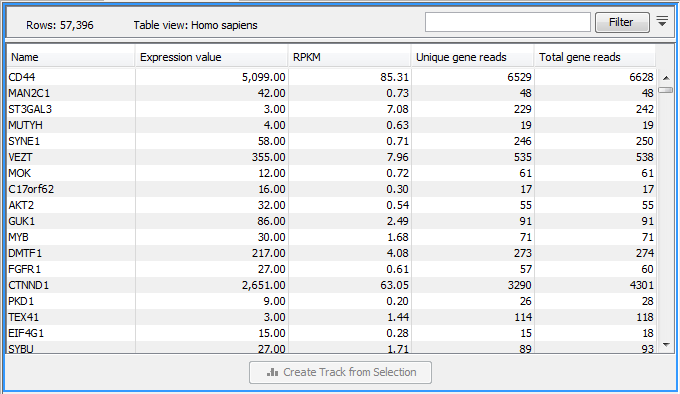
Figure 31.47: A subset of a result of an RNA-Seq analysis on the gene level. Not all columns are shown in this figure
Each row in the table corresponds to a gene (or reference sequence, if the One reference sequence per transcript option was used). The corresponding counts and other information is shown for each gene:
- Name. The name of the gene, or the name of the reference sequence if "one reference sequence per transcript" is used.
- Chromosome and region. The position of the gene on the genome.
- Expression value. This is based on the expression measure chosen as described in Calculating expression values from RNA-Seq.
- Gene length The length of the gene as annotated.
- TPM (Transcripts per million). This is computed as
 , where the sum is over the RPKM values of all genes/transcripts (see http://bioinformatics.oxfordjournals.org/content/26/4/493.long).
- RPKM. This is the expression value measured in RPKM [Mortazavi et al., 2008]:
 . See RPKM for a detailed definition.
- Unique gene reads. This is the number of reads that match uniquely to the gene or its transcripts.
- Total gene reads. This is all the reads that are mapped to this gene - both reads that map uniquely to the gene or its transcripts and reads that matched to more positions in the reference (but fewer than the 'Maximum number of hits for a read' parameter) which were assigned to this gene.
- Transcripts annotated. The number of transcripts annotated for the gene. Note that this is not based on the sequencing data - only on the annotations already on the reference sequence(s).
- Uniquely identified transcripts. The number of transcripts with at least one mapped read that matches only that transcript and no others. Note that if a gene has 4 detected transcripts, and 8 undetected transcripts, all 4+8=12 transcripts will have the value "Uniquely identified transcripts = 4".
- Exon length. The total length of all exons (not all transcripts).
- Exons. The total number of exons across all transcripts.
- Unique exon reads. The number of reads that match uniquely to the exons (including across exon-exon junctions).
- Total exon reads. The total number of reads assigned to an exon or an exon-exon junction of this gene. As for the 'Total gene reads' this includes both uniquely mapped reads and reads with multiple matches that were assigned to an exon of this gene.
- Ratio of unique to total (exon reads). The ratio of the unique reads to the total number of reads in the exons. This can be convenient for filtering the results to exclude the ones where you have low confidence because of a relatively high number of non-unique exon reads.
- Unique exon-exon reads. Reads that uniquely match across an exon-exon junction of the gene (as specified in figure 31.43). The read is only counted once even though it covers several exons.
- Total exon-exon reads. Reads that match across an exon-exon junction of the gene (as specified in figure 31.43). As for the 'Total gene reads' this includes both uniquely mapped reads and reads with multiple matches that were assigned to an exon-exon junction of this gene.
- Total intron reads. The total number of reads that map to an intron of the gene.
- Ratio of intron to total gene reads. This can be convenient to identify genes with poor or lacking transcript annotations. If one or more exons are missing from the annotations, there will be a relatively high number of reads mapping in the intron.
Transcript-level expression
If the "Genome annotated with genes and transcripts" option is selected in figure 31.35, a transcript-level expression track (TE) is also generated.
The track can be opened in a Table view (![]() ) allowing sorting and filtering on all the information in the track. Each row in the table corresponds to an mRNA annotation in the mRNA track used as reference.
) allowing sorting and filtering on all the information in the track. Each row in the table corresponds to an mRNA annotation in the mRNA track used as reference.
- Name. The name of the transcript, or the name of the reference sequence if "one reference sequence per transcript" is used.
- Chromosome and region. The position of the gene on the genome.
- Expression value. This is based on the expression measure chosen as described in Calculating expression values from RNA-Seq.
- TPM (Transcripts per million). This is computed as
, where the sum is over the RPKM values of all genes/transcripts (see http://bioinformatics.oxfordjournals.org/content/26/4/493.long).
- RPKM. This is the expression value measured in RPKM [Mortazavi et al., 2008]:
. See RPKM for a detailed definition.
- Relative RPKM. The RPKM for the transcript divided by the maximum of the RPKM values among all transcripts of the same gene. This value describes the relative expression of alternative transcripts for the gene.
- Gene name. The name of the corresponding gene.
- Transcript length. This is the length of the transcript.
- Exons. The total number of exons in the transcript.
- Transcript ID. The transcript ID is taken from the transcript_id note in the mRNA track annotations and can be used to differentiate between different transcripts of the same gene.
- Transcripts annotated. The number of transcripts based on the mRNA annotations on the reference. Note that this is not based on the sequencing data - only on the annotations already on the reference sequence(s).
- Uniquely identified transcripts. The number of transcripts with at least one mapped read that matches only that transcript and no others. Note that if a gene has 4 detected transcripts, and 8 undetected transcripts, all 4+8=12 transcripts will have the value "Uniquely identified transcripts = 4".
- Unique transcript reads. This is the number of reads in the mapping for the gene that are uniquely assignable to the transcript.
- Total transcript reads. Once the 'Unique transcript read's have been identified and their counts calculated for each transcript, the remaining (non-unique) transcript reads are assigned to one of the transcripts to which they match. The 'Total transcript reads' counts are the total number of reads that are assigned to the transcript once this assignment has been done. As for the assignment of reads among genes, the assignment of reads within a gene but among transcripts, is done by the EM estimation algorithm (EM estimation algorithm).
- Ratio of unique to total (transcript reads). The ratio of the unique reads to the total number of reads in the transcripts. This can be convenient for filtering the results to exclude the ones where you have low confidence because of a relatively high number of non-unique transcript reads.
Additional information to GE or TE tracks
Both GE and TE tables can offer additional information such as hyperlinks to various databases (e.g., ENSEMBL, HGNC (HUGO Gene Nomenclature Committee), RefSeq, GeneID, etc.) In cases where the mRNA track or the gene track provided have biotype information, a biotype column will be added to the table.
RNA-Seq reads track
A track containing the mapped reads can be generated by the tool if the option to do so is enabled. Details about viewing and editing of reads tracks are described in Tracks and Reads tracks.
If you have chosen the strand specific option when setting up your analysis, it may be helpful to note that the colors of mapped single reads represent the orientation of the read relative to the reference provided. When a gene track is provided along with the reference genome, the reads will be mapped using the strand you specified, but the coloring of the read will be relative to the reference gene. If the reads matches the orientation of the gene it is colored green, and if it is opposite to the orientation of the gene it is colored red. A summary list of the colors to expect with different combinations of gene orientation and strand specific mapping options is:
- Strand specific, forward orientation chosen + gene on plus strand of reference = single reads colored green.
- Strand specific, forward orientation chosen + gene on minus strand of reference = single reads colored red.
- Strand specific, reverse orientation chosen + gene on plus strand of reference = single reads colored red.
- Strand specific, reverse orientation chosen + gene on minus strand of reference = single reads colored green.
See figure 31.45 for an example of forward and reverse reads mapped to a gene on the plus strand.
Note: Reads mapping to intergenic regions will not be mapped in a strand specific way.
Although paired reads are colored blue, they can be viewed as red and green 'single' reads by selecting the Show strands of paired reads box, within the Read Mapping Settings bar on the right-hand side of the track.
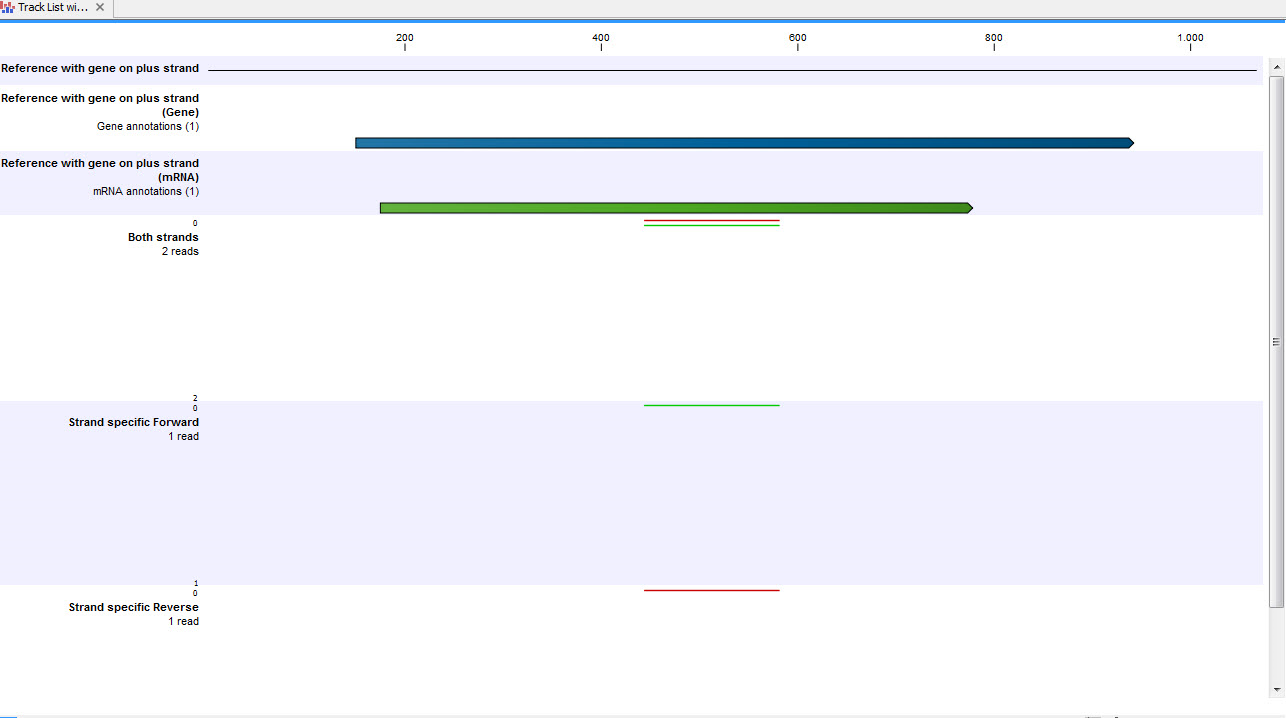
Figure 31.48: A track list showing a gene and transcript on the plus strand, and various mapping results. The first reads track shows a mapping of two reads (one 'forward' and one 'reverse') using strand specific 'both' option. Both reads map successfully; the forward read colored green (because it matches the direction of the gene), and the reverse read colored red. The second reads track shows a mapping of the same reads using strand specific 'forward' option. The reverse read does not map because it is not in the correct direction, therefore only the green forward read is shown. The final reads track shows a mapping of the same reads again but using strand specific 'reverse' option. This time, the green forward read does not map because it is in the wrong direction, and only the red reverse read is shown.