Output of the Detect QIAseq MSI Status workflow
The workflow will output a report indicating whether the sample was found to be stable (MSS) as seen in figure 6.37 or unstable (MSI) as in figure 6.38. Instability is reported as low instability (MSI-L) or high instability (MSI-H). Below the summary tables, are graphs representing length distributions for each locus (shown here to the right of the summary tables).
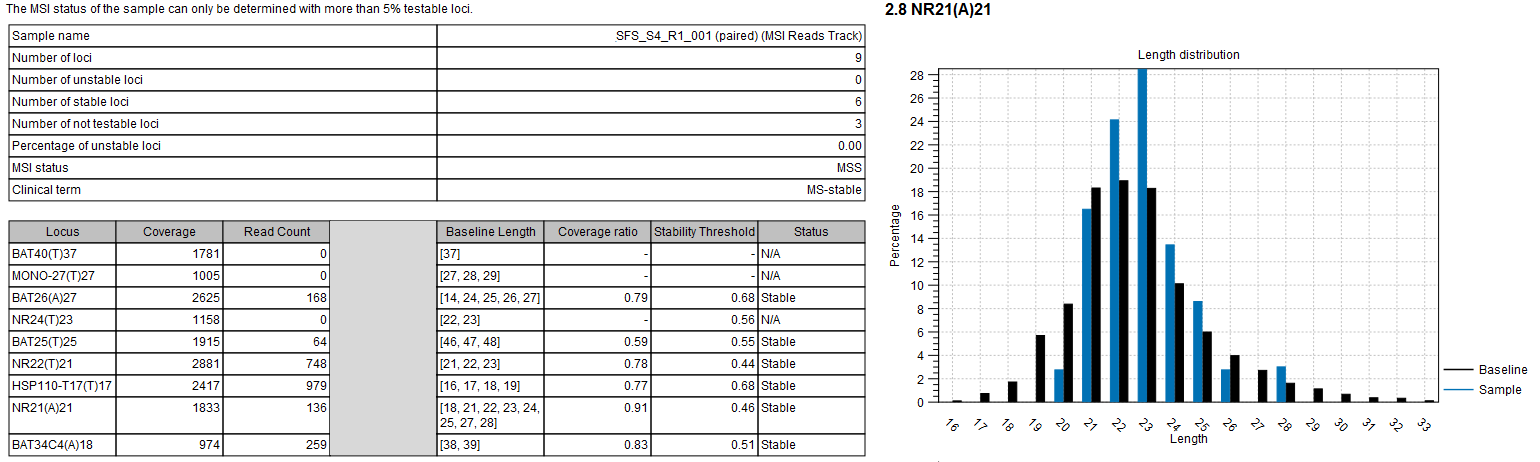
Figure 6.37: Report from a stable sample, and graph for the locii NR21(A)21 loci.
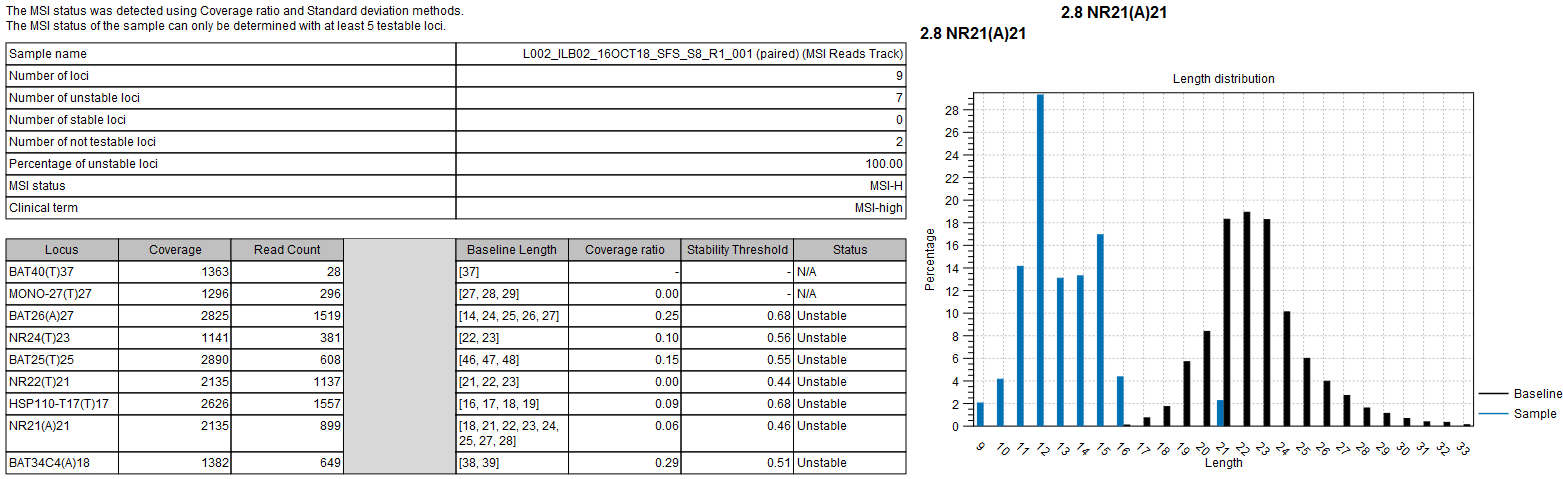
Figure 6.38: Report from an unstable sample, and graph for the locii NR21(A)21 loci.
Additional information about the MSI report is available in the Detect MSI Status tool description (Detect MSI Status ).