Detect and Refine Fusion Genes
Detect and Refine Fusion Genes finds fusion genes in a two-step process. The detect step identifies potential fusions and the refine step accumulates and evaluates the evidence for each fusion. Briefly, the detect step works by re-mapping the unaligned ends of reads and determining if these are consistent with a fusion. Fusions are identified from reads that must have an unaligned end close to an exon boundary that can be remapped close to another exon boundary. If the option for Detect fusions with novel exon boundaries has been enabled, the tool also considers reads that are far from an exon boundary and/or whose unaligned ends can be mapped far from an exon boundary in a second pass.
The refine step takes the fusions identified in the detect step, and re-counts the number of fusion crossing reads as well as the wildtype supporting reads using an RNA-Seq mapping against the wild type and fusion references. The fusion reference is an artificial reference sequence that "assumes" the detected fusions by generating new chromosomes corresponding to each fusion in addition to the original chromosomes (figure 7.13).
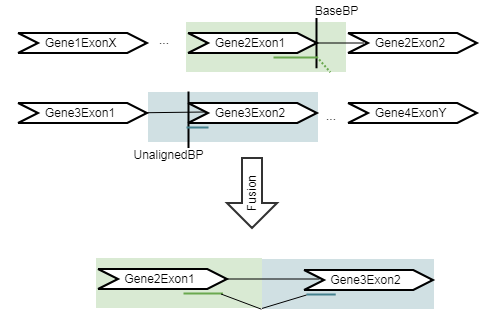
Figure 7.13: An artificial chromosome is created consisting of the vicinity of both ends of the fusion.
All reads are remapped to the artificial reference, with the expectation that reads that were used to detect the fusion will now map to the fusion transcript with a spliced read. In addition, some reads that did not originally map at all will now map to the artifical reference sequence, increasing evidence for the fusion event. The tool then calculates the Z-score and p-value using a binomial test.
The Detect and Refine Fusion Genes tool can be found in the Toolbox at:
Tools | QIAseq Panel Expert Tools (![]() ) | QIAseq RNAscan Panel Expert Tools (
) | QIAseq RNAscan Panel Expert Tools (![]() ) | Detect and Refine Fusion Genes (
) | Detect and Refine Fusion Genes (![]() )
)
The Detect and Refine Fusion Genes tool takes takes a sequence list (![]() ) as input (figure 7.14).
) as input (figure 7.14).
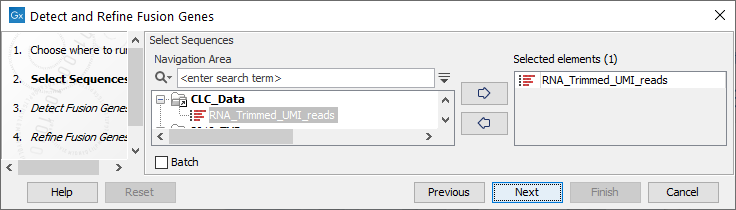
Figure 7.14: Select sequences.
In the next dialog figure 7.15, specify the reads track containing an RNA-seq read mapping as well as reference sequence, gene and mRNA tracks from the CLC_References folder of the Navigation Area. It is possible - but optional - to add a CDS or primer track to run the analysis.
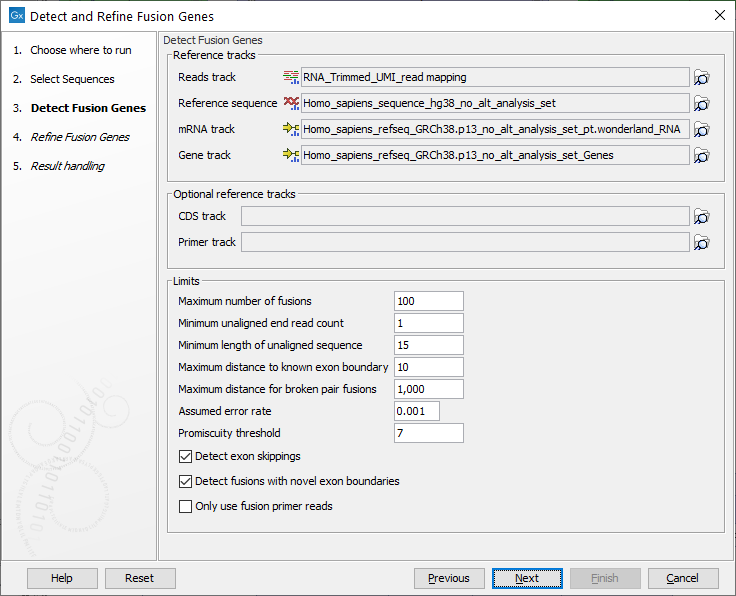
Figure 7.15: Specify reads track, references and parameters for the detection.
The additional parameters to set are:
- Maximum number of fusions: The maximum number of putative fusions that will be evaluated. Multiple different possible fusion breakpoints between the same two genes count as 1 fusion.
- Minimum unaligned end read count: The minimum number of unaligned ends that must support a fusion, if lower than this number the fusion will not be considered in the refine step.
- Minimum length of unaligned sequence: Only unaligned ends longer than this will be used for detecting fusions.
- Maximum distance to known exon boundary: Reads with unaligned ends must map within this distance of a known exon boundary, and unaligned ends must map within this distance of another known exon boundary, to be recorded as supporting a fusion event.
Increasing this parameter counts reads that are further from a known exon boundary as if they fused at the boundary, which increases the signal for the fusion. However, increasing the parameter also decreases the resolution at which a fusion can be detected: for example, if "maximum distance to known exon boundary = 10" then two transcripts with exon boundaries 9nt apart will not be distinguished, and the tool will only produce artificial fusion transcripts for one of them, which can reduce the number of mapping reads in the refine step.
- Maximum distance for broken pairs fusions: The algorithm uses broken pairs to find additional support for fusion events. If a pair of reads originally mapped as a broken pair, but would not be considered broken if mapped across the fusion breakpoints (because the two reads in the pair then get close enough to each other), then that pair of reads supports the fusion event as "fusion spanning reads". The "Maximum distance for broken pairs fusions" parameter specifies how close to each other two broken pairs must map across the fusion breakpoints in order for them to be considered fusion spanning reads. This is usually set to the maximum paired end distance used for the Illumina import of reads.
- Assumed error rate: Value used to calculate Z-score and p-value.
- Promiscuity threshold: Only up to this number of fusion partners will be reported for a given gene.
This parameter does not limit the number of fusion breakpoints that can be reported between two genes, which is capped at 20 pairs of breakpoints:
We limit the number of breakpoint pairs between the same two genes by selecting the highest possible p-value threshold that admits at most 20 breakpoint pairs.
- Detect exon skippings: Check this option to consider exon skippings.
- Detect fusions with novel exon boundaries: When enabled, fusions beyond the distance set for "Maximum distance to known exon boundary" are additionally reported where breakpoints are not at canonical exon boundaries.
- Only use fusion primer reads: When enabled, the input sequence list is filtered to retain only reads that are annotated as originating from a primer that is designed for fusion calling. This option requires the reads to have been annotated by the tool Extract Reads Matching Primers.
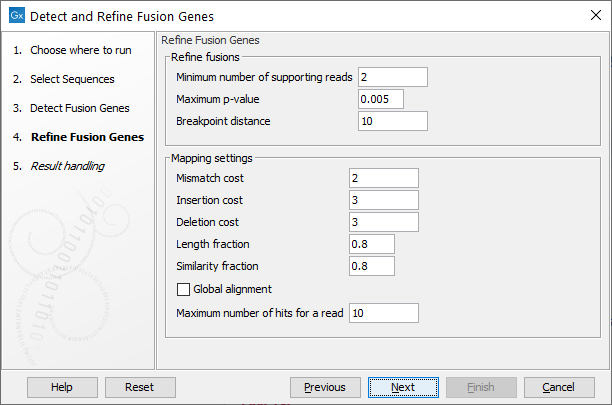
Figure 7.16: Specify parameters for refinement.
- Minimum number of supporting reads: Minimum number of reads that should support a fusion. Fusions with fewer supporting reads will get a corresponding filter annotation.
- Maximum p-value: Fusions with p-value above this threshold will get a corresponding filter annotation.
- Breakpoint distance: The minimum distance from one end of a read to the breakpoint, or in other words the minimum number of nucleotides that a read must cover on each side of the breakpoint, for it to be counted as a fusion supporting read. If you set this value to 10, reads which only covers 9 bases on one side of the breakpoint will not count as fusion evidence.
The remaining parameters apply to the RNA-seq read mapping to the artificial references (see https://resources.qiagenbioinformatics.com/manuals/clcgenomicsworkbench/current/index.php?manual=Mapping_settings.html for details).
Output from the Detect and Refine Fusion Genes tool
The Detect and Refine Fusion Genes tool produces a number of outputs:
- Fusion Genes (WT): The Fusion Genes track contains the breakpoints of all detected fusions. The track is described in more details below, see 7.4.1.
- Reads (WT): A read mapping to the WT genome. Reads are mapped to a combination of the WT genome and the artificial fusion chromosomes. Reads mapping better to the artificial fusion chromosomes will be in the Reads (fusions) output.
- Unaligned Ends: A read mapping showing where the ualigned ends map to the reference genome. The unaligned ends track is useful when choosing how to set the parameters "Minimum unaligned end read count", "Minimum length of unaligned sequence", and "Maximum distance to exon boundary" for a particular panel and sequencing protocol in order to find known fusions, as it shows which unaligned ends of reads were considered and where they were mapped.
- Fusion Genes (fusions): Breakpoints for the detected fusions on the artificial reference.
- Reads (fusions): A read mapping to the artificial fusion chromosomes. Reads are mapped to a combination of the WT genome and the artificial fusion chromosomes. Reads mapping better to WT genome will be in the Reads (WT) output.
- Reference Sequence (fusions): Reference sequence for the artificial reference.
- mRNA (fusions): mRNA transcripts corresponding to the detected fusions on the artificial reference.
- Genes (fusions): Gene region for the fused gene product on the artificial reference.
- CDS (fusions): If the CDS track was provided, this track contains the CDS region for the fused gene product on the artificial reference.
- Primers (fusions): If a primer track was provided, this track contains the primer regions on the artifical reference. Note that only primers for genes involved in a detected fusion will be represented here, and that the same primer can be in multiple fusion chromosomes, if the the same gene is involved in multiple fusions.
- Report: A report containing graphical representations of the fusions passing all filters. The report is described in more detail below, see 7.4.1.
Fusion tracks
The fusion track has a table view containing the following information:
- Chromosome. Chromosome where "Gene" and "Transcript" are located.
- Region. Breakpoint position of the fusion event relative to the reference sequence hg38.
- Name. Short name of the fusion event, 5' gene-3' gene.
- Fusion number. Numbers rows that describe fusions between the same two genes.
- Fusion pair. Numbers pairs of fusion breakpoints for a given fusion number.
- 5' or 3' Gene. The fusion gene that corresponds to the "Chromosome" and "Region" fields.
- Breakpoint type. 3' or 5'.
- Fusion Crossing Reads. Number of reads crossing the fusion breakpoint.
- 5' or 3' Read Coverage. Number of reads (unaligned ends and pairs) that cover the 5' or 3'-transcript breakpoint, including normal transcripts and fusion transcripts.
- Z-score. Converted from the P-value using the inverse distribution function for a standard Gaussian distribution.
- P-value. A measure of certainty of the call calculated using a binomial test, it is calculated as the probability that an observation indicating a fusion event occurs by chance when there is no fusion. The closer the value is to 0, the more certain the call. Although one should avoid strictly interpret the p-value as the true false positive rate, our test data show that the p-value seems to be appropriately calibrated using standard parameter settings.
- Filter. Contains the names of the filters applicable to the fusion, or the value "PASS" if it passed all filters.
- Translocation Name. Description of the fusion in the COSMIC format (http://cancer.sanger.ac.uk/cosmic/help/fusion/summary) using the preferred transcript.
- Exon skipping. Whether the fusion is a same-gene fusions where the 5' breakpoint is upstream of the 3' breakpoint.
- Fusion with novel exon boundaries. Indicates if one or both fusion breakpoints are at a novel exon boundary.
- Found in-frame CDS. This column is present when a CDS track was specified as input. It contains "Yes" if at least one fusion CDS that stays in frame across the fusion breakpoints has been found. Note that the in-frame calculation only takes into account the frame of the last included exon in the 5' gene and the first included exon in the 3' gene, and ignores more complex factors that might affect frame, such as frameshift mutations or stop codons due to variants around the fusion breakpoints.
- Compatible Transcripts. All known transcripts with which the fusion reads are compatible. Transcripts are 'compatible' with fusion reads if they include the exon boundary at which the fusion occurs. If there are no known compatible transcripts then an artificial transcript will be listed with a name such as "10-gene27693-32015547-BEGINNING-0" This shows that the transcript was created for gene27693 on chromosome 10, by modifying the beginning of an existing exon, in order to describe a breakpoint at position 32015547 (the final "0" is just a counter).
- Original chromosome. (only in tracks based on a fusion reference)
- Original breakpoint region. (only in tracks based on a fusion reference)
- Known Fusion. Indicates the Fusion ID Number of the matching fusion in the known fusion database. If the fusion is not found in the database, then -1 is reported. By default, the tool uses a QIAGEN known fusion database, but you can replace this database with another known fusions database relevant to your assay. Note that this database is not used to detect the fusions, but only for annotating the identified fusions output from the Detect and Refine Fusion Genes before refinement.
- Fusion Plot. Contains a link to a QIMERA fusion plot. Click on the link to open the plot.
Detect and Refine Fusion Genes report
In the Result handling dialog, it is possible to choose to output a report containing sample and unaligned ends information as well as detailed information and plots for all fusions passing filters (figure 7.17):
This report can be used together with the Combine Reports tool (see http://resources.qiagenbioinformatics.com/manuals/clcgenomicsworkbench/current/index.php?manual=Combine_Reports.html)
The report has three sections: "Summary", "Unaligned Ends" and "Fusions". The summary section has a table with the sample name. The unaligned ends section contains a table with statistics on the unaligned ends used to detect fusions, the table has the following information:
- Unaligned ends: number of found unaligned ends.
- Mapped unaligned ends: number of unaligned ends which could be mapped
- Unmapped unaligned ends: number of unaligned which could not be mapped.
- Discarded base breakpoints: when two transcripts of the same gene overlap so that two breakpoints are found next to each other, one of them will be discarded.
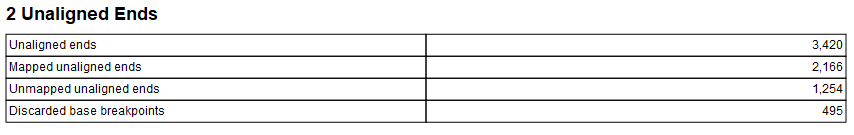
Figure 7.17: Unaligned ends section in Detect and Refine Fusions report.
The Fusion section lists all fusions with FILTER=PASS. Each Fusion Gene is described by two tables and a fusion plot (figure 7.18).
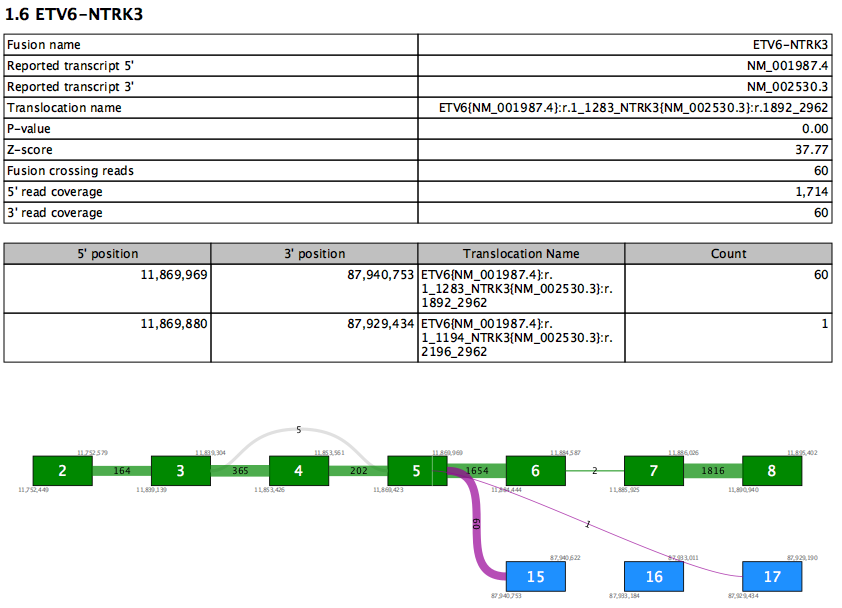
Figure 7.18: A report section for a fusion gene.
The first table contains an overview of the most supported fusion for the fusion gene. Values in this table include:
- Reported transcript 5'/3' - the reported transcript is the highest priority transcript that is compatible with this fusion
- Translocation name - HGVS description of the fusion against the reported transcripts
- Fusion crossing reads - the number of reads that splice from the 5' exon and into the 3' exon
- 5'/3' read coverage - the total number of reads that splice at the 5'/3' exon. This number is therefore always at least as high as fusion crossing reads.
The second table lists values for all supported fusion breakpoints in the fusion gene, sorted by read count. Therefore the first row in the table recapitulates some of the values from the first table. Additional rows show evidence for other fusions between the same two genes. At most 10 rows are shown.
The fusion plot visualizes all fusions between the reported transcripts.
- Green box - an exon in the 5' reported transcript
- Blue box - an exon in the 3' reported transcript
- Gray box - an exon that is not in the reported transcript. This may be present in other transcripts, or may represent a novel exon not seen in any transcript.
- Purple lines - fusion connections. The number of reads supporting the fusion is written on the line. Note that it is possible for a fusion present in the second table to be absent here if that fusion is between exons not present in the reported transcripts.
- Gray lines - connections due to alternative splicing between exons in the reported transcript. The number of reads splicing between the exons is shown on each line.
- White vertical lines within green or blue boxes - indicate that fusion reads spliced > 12nt into the exon rather than at the exon boundary
Known limitations
- The tool is not suitable for detection of circRNAs. Evidence of back-splicing is filtered out.
- Fusions that involve a mix of sense and antisense exons are filtered out.
- Fusions that involve more than two genes in the fusion product are not explicitly detected.
- Fusions will not be reported for a gene if they involve fusing into a region before the first annotated exon or after the last annotated exon of that gene.