Interpretation of fusion results
The easiest way to review the results is to open the Fusion report and Genome Browser View (Fusions) outputs. Key aspects to verify when inspecting the results of fusion calls are:
- Reads map uniquely across the fusion breakpoints
In figure 7.9 many reads map to the artificial fusion chromosome. Although reads that do not map uniquely (yellow) are not counted as fusion crossing reads in the fusion statistics, a large fraction of yellow reads may still indicate a potential case where the fusion call might be less reliable. For example, it may indicate a high degree of homology between genes targeted by the panel.
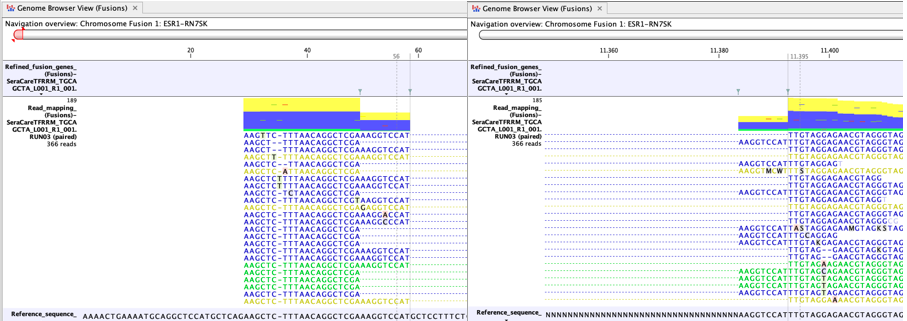
Figure 7.9: An example of a possible false positive fusion in a Genome Browser View (Fusions). - There is no sign of incomplete poly-A trimming
Another cause of false positives is incomplete poly-A trimming. In these cases one side of the fusion has normal complexity, but the other side of the fusion is A-rich. Figure 7.10 shows a clear example of a false positive caused by incomplete poly-A trimming.
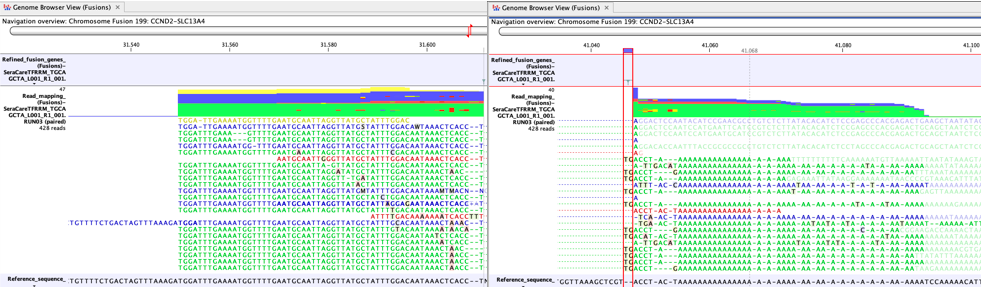
Figure 7.10: A false positive fusion CCND2-SLC13A4 caused by incomplete poly-A trimming, as seen in a Genome Browser View (Fusions) - The fusion is not a known false positive fusion
Fusions where one of the gene partners is either mitochondrial or HLA can also for the most part be disregarded as they are found regularly in normal RNA-seq data.
The following fusions can additionally be disregarded as common read-through mRNAs or false fusions due to gene homology.
- HALC1-COLQ, common read through
- TMP3-TMP4 (TMP4-TMP3), homologous genes
The fusions listed above are found when running catalog QIAseq Targeted RNAscan Panels; additional false positive fusions may be found when running custom made panels.
- Fusions involving insertion of intronic sequence are well supported
Fusions that include the insertion of intronic sequence can be detected. In the fusion plot, the intronic sequence appears as a "novel exon" indicated with a gray box. If one of the fusion partners is a novel exon, and there is otherwise no support for the fusion, the fusion should be treated with caution. Such fusions as not filtered away by default as missing support may be a consequence of the primer design.
For example, figure 7.11 shows a fusion where the novel exon has no support except for the fusion crossing reads. Additionally, although there are 431 such reads, they do not fuse into an annotated exon boundary, but instead into the middle of an exon. This fusion is likely to be a false positive.
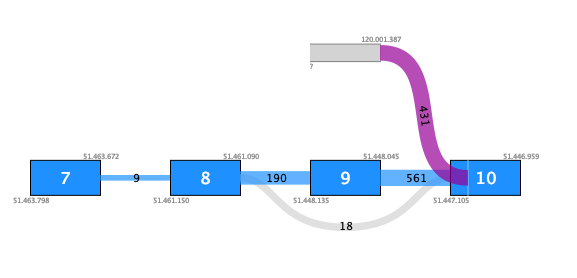
Figure 7.11: Fusion plot for a likely false positive fusion where the insertion of intronic sequence is only supported by fusion crossing reads that are not at an exon boundary.Figure 7.12 shows a fusion where the novel exon is supported both by 48 fusion crossing reads spliced at an annotated exon boundary, and by 3 reads that independently show splicing from the novel exon into an annotated exon. This is a true positive fusion.
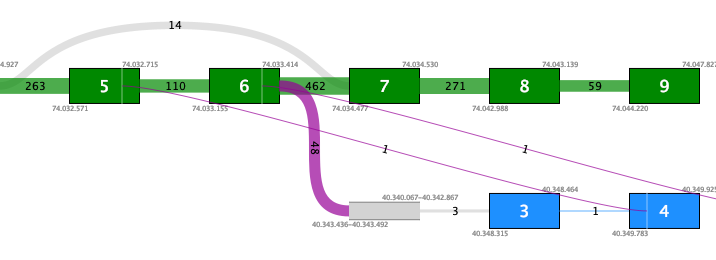
Figure 7.12: Fusion plot for a true positive fusion of PML-RARa that includes the insertion of intronic sequence. The fusion is supported by 48 fusion crossing reads at an exon boundary and 3 reads from the intronic sequence into an annotated exon.
Note about false negative fusions
The parameters for statistical significance are deliberately conservative. The assumed error rate is set to 0.001, meaning that at least 1 in a 1000 reads covering the breakpoints should support the fusion. Additionally the maximum p-value is set to 0.005. For detecting very low frequency fusions these parameters should be adjusted: Right click the Detect QIAseq RNAscan Fusions workflow and click "Open Copy of Workflow", then double-click "Refine fusion Genes" to configure this tool. To make the filtering less conservative either increase the p-value or decrease the assumed error rate.
Note that while fusions that do not meet the statistical significance threshold will not be shown in the Fusion Report, they can still be found in the Fusion Gene track, where they will have the filter annotation "High p-value".