CNV results report
The report contains information about the results of the CNV and LOH Detection tool.
Normalization The Normalization section gives information about the sample-level and chromosome-level coverages. Any chromosomes with disproportionate coverages are noted; targets on these chromosomes were ignored when setting up the statistical models.
Target-level log2-ratios The target-level coverage log-ratios are presented as a graph. Double click on it to see it in full view and access data points in a table.
An example is shown in figure 24.11. On the horizontal axis, the targets are placed in the order in which they appear in the genome. On the vertical axis, the adjusted coverage log-ratio of each target is plotted. The black line represents the actually observed mean adjusted log-ratio of coverage for each target. The cyan and red lines represent the 95% confidence intervals of the expected mean adjusted log-ratios of coverages, based on the statistical model. Chromosome boundaries are indicated as vertical lines.
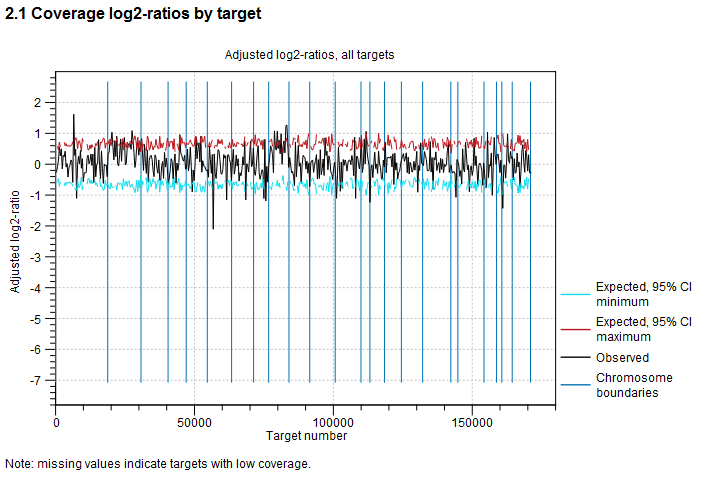
Figure 24.11: An example graph showing the mean adjusted log-ratios of coverages in the report produced by the CNV and LOH Detection tool. In this example, the second and ninth chromosomes are amplified, and the log-ratios of coverages of targets on these chromosome are significantly higher than for targets on other chromosomes. The black line in these regions is outside the boundaries defined by the cyan and red lines.
CNV statistics This section of the report provides some information about the number of CNVs called in the region-level prediction results. The number of uncalled or filtered regions are also shown.
Loss-of-heterozygosity This section provides information related to LOH detection. The first table shows the estimated purity and normalization factor along with confidence intervals. Low purity or a wide confidence interval for purity is an indication that the LOH predictions are uncertain. In the next table the number of targets predicted to be in each ploidy state is shown.
The next two subsections provide information useful for diagnosing potential problems with LOH detection. First, the expected coverage log-ratios for each ploidy state are shown along with the average coverage log-ratios for targets predicted to have this state. The expected coverage log-ratios are simply computed as in table 24.2 based on the estimated purity. Below the table is a plot with coverage log-ratios plotted against the base coverage. The points are colored by their predicted state and horizontal lines indicate the expected log-coverage ratio for each state (Figure 24.12).
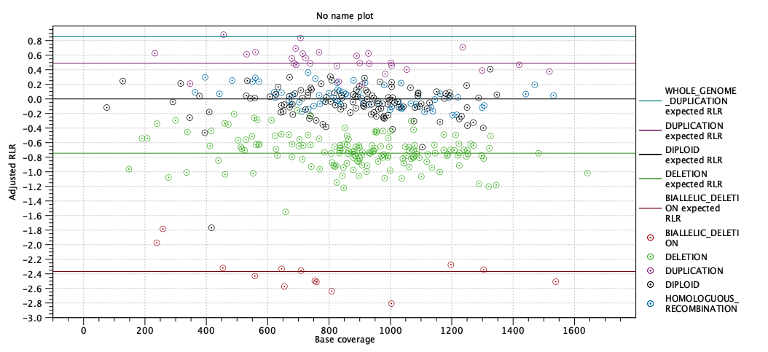
Figure 24.12: Log-coverage ratios for each target with horizontal lines indicating the expected log-coverage ratio.
Second, the expected allele frequencies for each ploidy state are shown along with the average allele frequency for variants predicted to have this state. Again the expected allele frequencies are computed as in table 24.3 based on the estimated purity. Below the table is a plot with allele frequencies plotted against their coverage. The points are colored by their predicted state and horizontal lines indicate the expected allele frequency for each state (Figure 24.13).
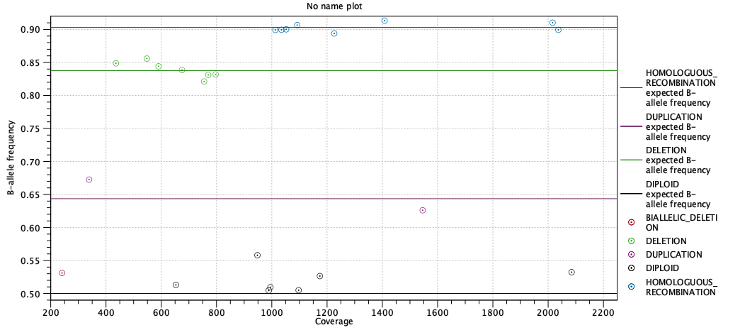
Figure 24.13: Allele frequencies for each putative heterozygous variant with horizontal lines indicating the expected allele frequencies.