Filter Somatic Variants (TAS)
If you are analyzing a list of variants that have been detected in a tumor or blood sample where no control sample is available from the same subject, you can use the Filter Somatic Variants (TAS) ready-to-use workflow to identify potential somatic variants. The purpose of this ready-to-use workflow is to use publicly available (or your own) databases, with common variants in a population, to extract potential somatic variants whenever no control/normal sample from the same subject is available.
This workflow accepts variant tracks (![]() ) (e.g. the output from the Identify Variants ready-to-use workflow) as input. Variants that are identical to the human reference sequence are first filtered away, then variants outside the targeted region are removed, and lastly, variants found in the Common dbSNP, 1000 Genomes Project, and HapMap databases are deleted. Variants in those databases are assumed to not contain relevant somatic variants.
) (e.g. the output from the Identify Variants ready-to-use workflow) as input. Variants that are identical to the human reference sequence are first filtered away, then variants outside the targeted region are removed, and lastly, variants found in the Common dbSNP, 1000 Genomes Project, and HapMap databases are deleted. Variants in those databases are assumed to not contain relevant somatic variants.
Please note that this tool will likely also remove inherited cancer variants that are present at a low percentage in a population.
Next, the remaining somatic variants are annotated with gene names, amino acid changes, conservation scores and information from ClinVar (known variants with medical impact) and dbSNP (all known variants).
Run the Filter Somatic Variants (TAS) workflow
To run the Filter Somatic Variants (TAS) tool, go to:
Toolbox | Ready-to-Use Workflows | Targeted Amplicon Sequencing (![]() ) | Somatic Cancer (
) | Somatic Cancer (![]() ) | Filter Somatic Variants (
) | Filter Somatic Variants (![]() )
)
- Double-click on the Filter Somatic Variants (TAS) tool to start the analysis. If you are connected to a server, you will first be asked where you would like to run the analysis.
- Next, you will be asked to select the variant track you would like to use for filtering somatic variants (figure 22.15).
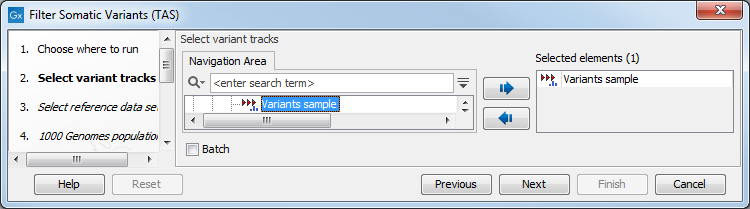
Figure 22.15: Select the variant track from which you would like to filter somatic variants. - In the next dialog, you have to select which data set should be used to filter somatic variants (figure 22.16).
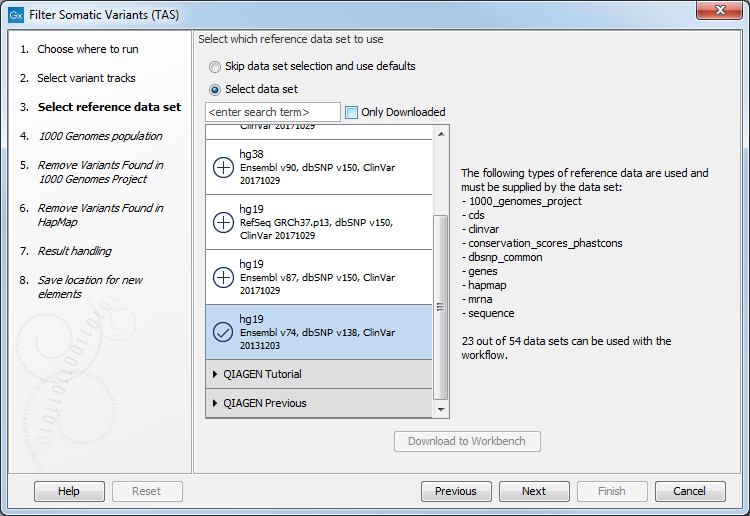
Figure 22.16: Choose the relevant reference Data Set to annotate. - In the next step you will be asked to specify which of the 1000 Genomes populations should be used for annotation (figure 22.17).
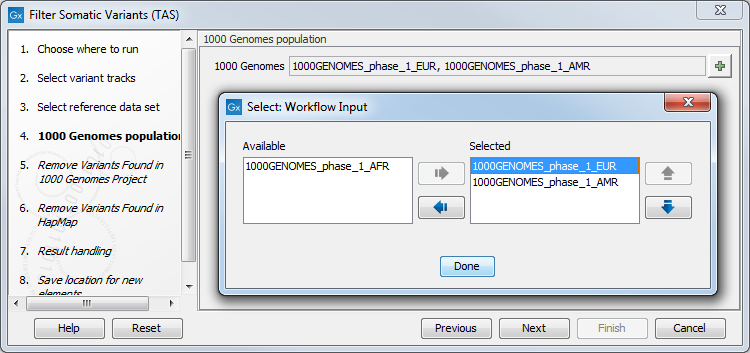
Figure 22.17: Specify which 1000 Genomes population to use for annotation. - The next wizard step will once again allow you to specify the 1000 Genomes population that should be used, this time for filtering out variants found in the 1000 Genomes project.
- Finally, the next wizard step (figure 22.18) concerns removal of variants found in the HapMap database. Select the population you would like to use from the drop-down list. Please note that the populations available from the drop-down list can be specified with the Reference Data Manager.
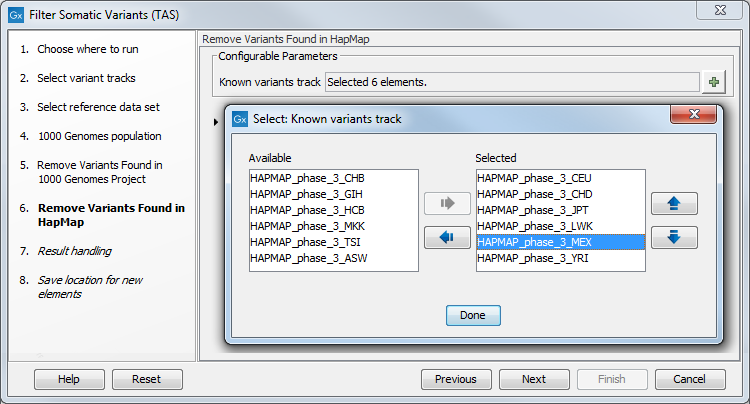
Figure 22.18: Specify which HapMap population to use for filtering out known variants. - In the last wizard step you can check the selected settings by clicking on the button labeled Preview All Parameters.
In the Preview All Parameters wizard you can only check the settings, and if you wish to make changes you have to use the Previous button from the wizard to edit parameters in the relevant windows.
- Choose to Save your results and click Finish.
Output from the Filter Somatic Variants (TAS) workflow
Two types of output are generated:
- Amino Acids Changes Track that shows the consequences of the variants at the amino acid level in the context of the original amino acid sequence. A variant introducing a stop mutation is illustrated with a red amino acid.
- Somatic Candidate Variants Track that holds the variant data. This track is also included in the Track List. If you hold down the Ctrl key (Cmd on Mac) while clicking on the table icon in the lower left side of the View Area, you can open the table view in split view. The table and the variant track are linked together, and when you click on a row in the table, the track view will automatically bring this position into focus.
- Track List Filter Somatic Variants A collection of tracks presented together. Shows the somatic candidate variants together with the human reference sequence, genes, transcripts, coding regions, and variants detected in ClinVar, 1000 Genomes, and the PhastCons conservation scores (see figure 22.19).
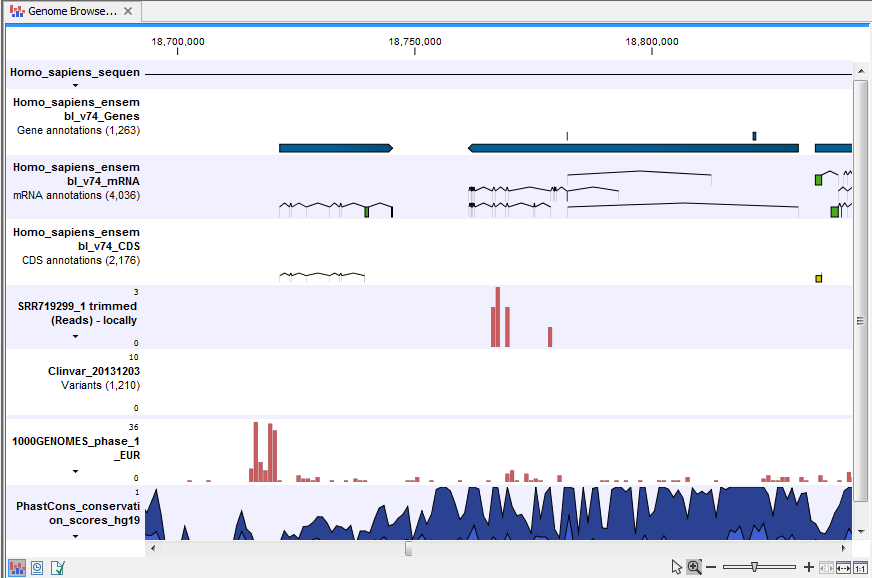
Figure 22.19: The Track List showing the annotated somatic variants together with a range of other tracks.
To see the level of nucleotide conservation (from a multiple alignment with many vertebrates) in the region around each variant, a track with conservation scores is added as well. Mapped sequencing reads as well as other tracks can be easily added to this Track List. Open the variant track as a table showing all variants and the added information/annotations (see figure 22.20).
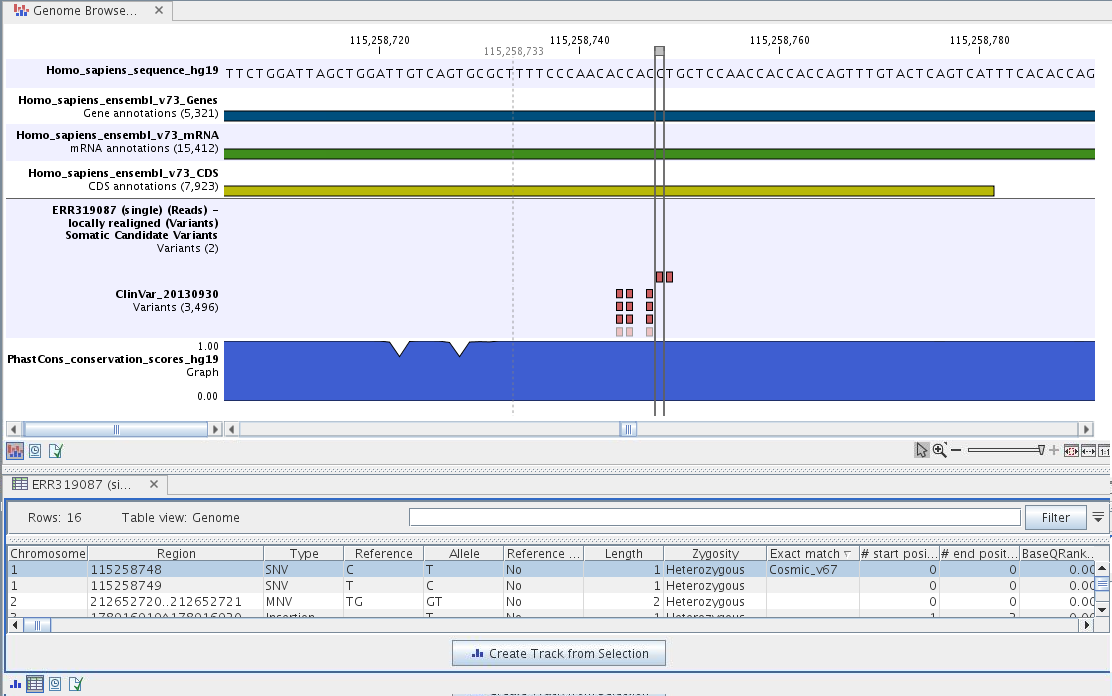
Figure 22.20: The Track List showing the annotated somatic variants together with a range of other tracks.
Adding information from other sources may help you identify interesting candidate variants for further research. E.g. common genetic variants (present in the HapMap database) or variants known to play a role in drug response or other relevant phenotypes (present in the ClinVar database) can easily be identified. Further, variants not found in the ClinVar databases, can be prioritized based on amino acid changes in case the variant causes changes on the amino acid level.
A high conservation level between different vertebrates or mammals, in the region containing the variant, can also be used to give a hint about whether a given variant is found in a region with an important functional role. If you would like to use the conservation scores to identify interesting variants, we recommend that variants with a conservation score of more than 0.9 (PhastCons score) is prioritized over variants with lower conservation scores.
It is possible to filter variants based on their annotations. This type of filtering can be facilitated using the table filter found at the top part of the table. If you are performing multiple experiments where you would like to use the exact same filter criteria, you can include in a workflow the Filter on Custom Criteria tool configured with the desired set of criteria.