The Identify TMB Status ready-to-use workflows
The Identify QIAseq DNA Somatic Variants with TMB Score (Illumina) or (Ion Torrent) has been designed to support the DHS-8800Z and DHS-6600Z QIAseq Targeted DNA panels. These panels cover a significantly larger region of the genome than classic Targeted DNA panels, which increases the difficulty of variant calling especially with regards to specificity. Through a series of tools and filters, the Identify TMB Status ready-to-use workflow has the ability to accurately call variants and to compute a TMB score and score confidence that can be classified as low, intermediate or high.
To run the workflows go to:
Ready-to-Use Workflows | QIAseq Panel Analysis (![]() ) | QIAseq Analysis Workflows (
) | QIAseq Analysis Workflows (![]() ) | Identify QIAseq DNA Somatic Variants with TMB Score (Illumina/Ion Torrent) (
) | Identify QIAseq DNA Somatic Variants with TMB Score (Illumina/Ion Torrent) (![]() )
)
These workflows can also be launched from the Analyze QIAseq Panels guide, which is described in The Analyze QIAseq Panels guide.They are available in the drop down menus under each panel analysis listed on the Targeted TMB/MSI tab.
If you are connected to a CLC Server via your Workbench, you will be asked where you would like to run the analysis. We recommend that you run the analysis on a CLC Server when possible.
You can then select the reads to analyze (figure 6.29).
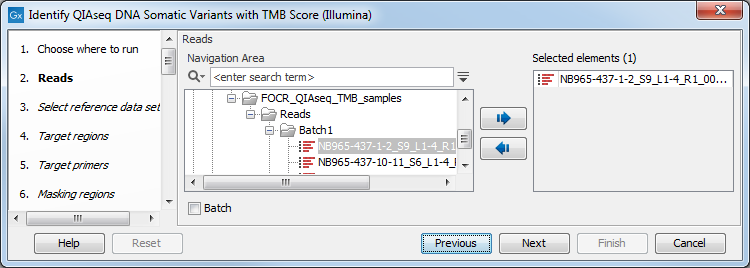
Figure 6.29: Choose the reads sequenced with a Tumor Mutational Burden QIAseq Targeted DNA panel.
The next dialog helps you specify the QIAseq TMB Panels hg38 Reference Data Set needed to run the workflow. If you have not downloaded this Reference Data Set yet, it is possible to do so in this dialog as well (figure 6.30).
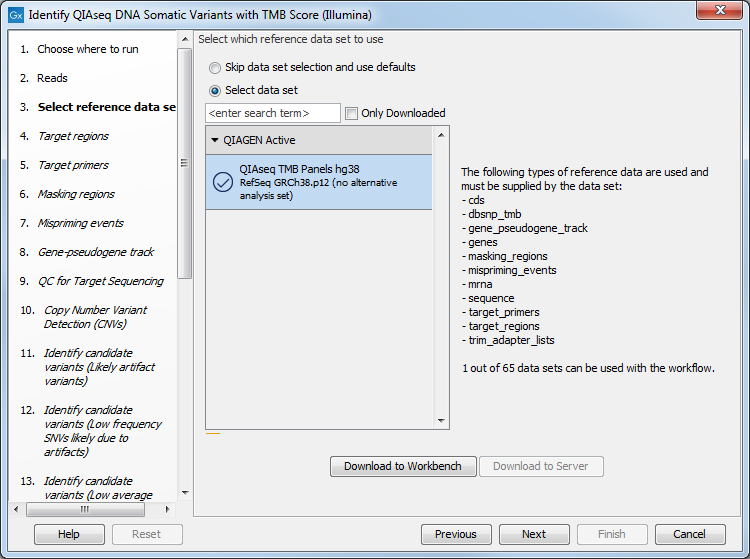
Figure 6.30: Choose the appropriate Reference Data Set.
In the Target regions dialog, select from the drop-down menu the track corresponding to the panel used to generate the reads analyzed (figure 6.31).
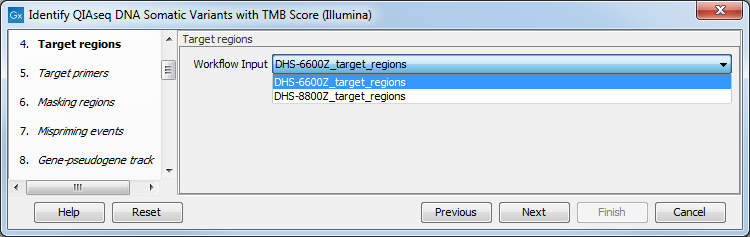
Figure 6.31: Choose the relevant Target regions track from the drop-down menu.
Repeat the selection of the appropriate track for Target primers, Masking regions, Mispriming events and Gene-pseudogene in the subsequent dialogs.
In the QC for Target Sequencing dialog, choose what minimum coverage is required for a variant to be considered of interest (figure 6.32). Variants whose coverage is below this value will be filtered out.
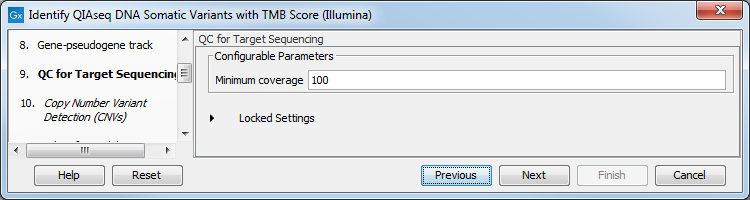
Figure 6.32: Configuring the QC for Target Sequencing tool.
The dialog for Copy Number Variant Detection allows you to specify a control mapping against which the coverage pattern in your sample will be compared in order to call CNVs. If you do not specify a control mapping, or if the target region files contains fewer than 50 regions, the Copy Number Variation analysis will not be carried out.
Please note that if you want the copy number variation analysis to be done, it is important that the control mapping supplied is a meaningful control for the sample being analyzed. Mapping of control samples for the CNV analysis can be done using the workflow described in Create QIAseq DNA CNV Control Mapping workflows.
A meaningful control must satisfy two conditions: (1) It must have a copy number status that it is meaningful for you to compare your sample against. For panels with targets on the X and Y chromosomes, the control and sample should be matched for gender. (2) The control read mapping must result from the same type of processing that will be applied to the sample. One way to achieve this is to process the control using the workflow (without providing a control mapping for the CNV detection component) and then to use the resulting UMI reads track as the control in subsequent workflow runs.
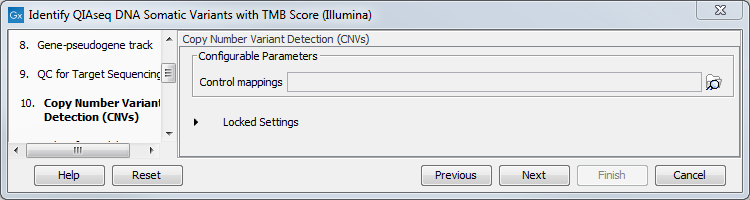
Figure 6.33: CNV Detection can be performed simultaneously if a control mapping is provided at this step.
In this case, the control mapping will be saved in the Reports and Data folder (Mapped UMI Reads) of that control analysis.
The parameters for variant detection are not adjustable and have been set to generate an initial pool of all potential variants. These are then passed through a series of filters to remove variants that are suspected artifacts. Variants failing to meet the (adjustable) thresholds for quality, read direction bias, location (low frequency indels within homopolymer stretches), frequency or coverage would not be included in the filtered output.
Some filters only remove alternative alleles - and not reference alleles - as this potentially leads to wrong interpretation of variants by the VCF exporter where such variants could be misinterpreted as hemizygote when the reference allele is missing.
Another series of filtering takes place just before TMB score calculation. In particular, the tool Calculate TMB Score removes, among others, germlines variants based on frequencies as well as known germline variants from dbSNP.
Note that each filter has been configured with specific default values depending on the technology (Illumina / Ion torrent) chosen to provide the best sensitivity and precision in the variants output by each workflow. However, benchmarking was performed on samples of relatively high coverage. Therefore, additional filtering might be needed, or filtering values adjusted when working with low coverage samples. This can only be done by running the workflows listed in the Toolbox, and not by using the panel guide. When configuring filters, do not load any annotations or try to change the name of the filters in the first column, as it would disable the filter completely.
In the Add Information about Amino Acid Changes step, leave the genetic code set to 1 Standard.
Finally enable the calculation of a TMB status and set appropriate thresholds values before specifying where you would like the results of the workflow to be saved.
Subsections