Identify Candidate Variants and Genes from Tumor Normal Pair
The Identify Candidate Variants and Genes from Tumor Normal Pair tool identifies somatic variants and differentially expressed genes in a tumor normal pair. One tumor normal pair can be compared at the time. If you would like to compare more than one pair you must repeat the analysis with the next tumor normal pair.
To run the ready-to-use workflow:
Toolbox | Ready-to-Use Workflows | Whole Transcriptome Sequencing (![]() ) | Human, Mouse or Rat | Identify Candidate Variants and Genes from Tumor Normal Pair (
) | Human, Mouse or Rat | Identify Candidate Variants and Genes from Tumor Normal Pair (![]() )
)
- Double-click on the Identify Candidate Variants and Genes from Tumor Normal Pair tool to start the analysis. If you are connected to a server, you will first be asked where you would like to run the analysis.
- Specify the RNA-seq reads from the tumor sample (the panel in the left side of the wizard shows the kind of input that should be provided as in figure 23.17). Click Next.
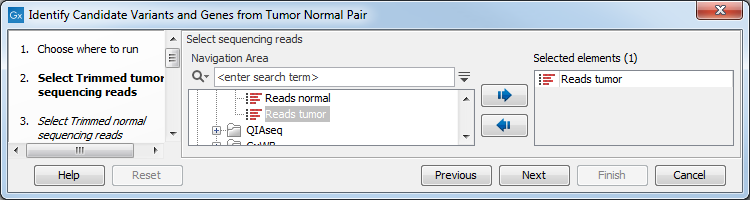
Figure 23.17: Select the RNA-seq reads from the tumor sample. - In the next step you will be asked to select the RNA-seq reads from the normal sample (see figure 23.18). Click Next.
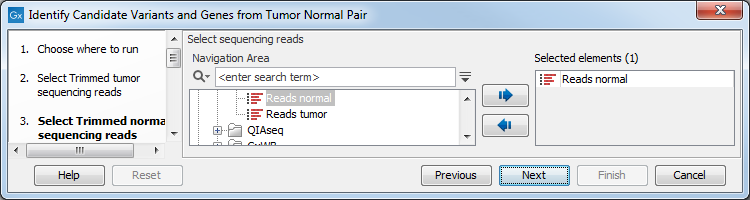
Figure 23.18: Select the RNA-seq reads from the normal sample. - Select the Reference Data Set that is relevant to your study (figure 23.19).
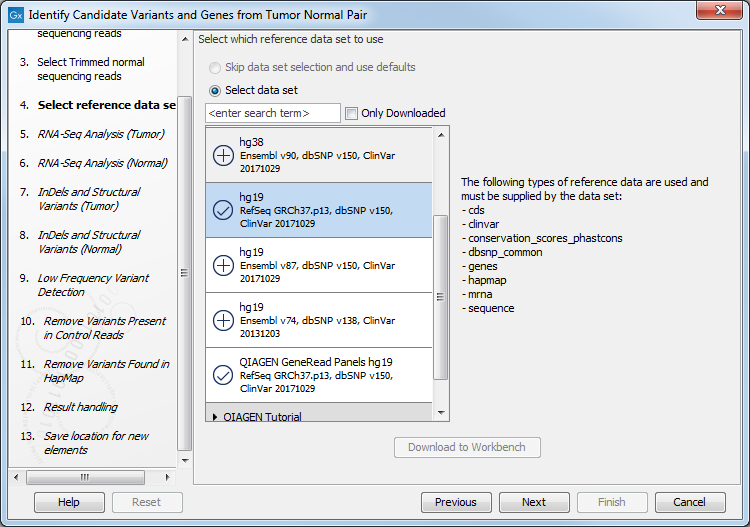
Figure 23.19: Select the relevant data set for the samples being studied. - Configure the parameters for the RNA-Seq Analysis (figure 23.20), first for the tumor sample, and then for the normal sample in the following step.
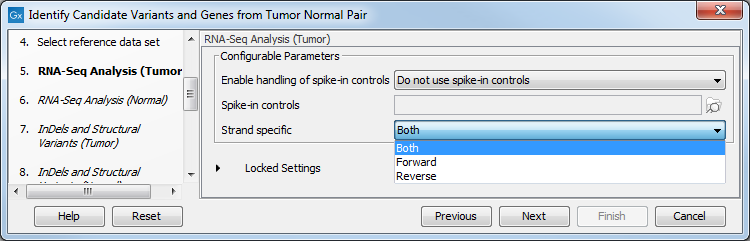
Figure 23.20: Configure the RNA-Seq Analysis. Here we specified a file for spike-in control but left the strand specific parameter to its default value.If you wish to use spike-in controls, add the relevant file in the "Spike-in controls" field.
You can also specify that the reads should be mapped only in their forward or reverse orientation (it is by default set to both). Choosing to restrict mapping to one direction is typically appropriate when a strand specific protocol for read generation has been used, as it allows assignment of the reads to the right gene in cases where overlapping genes are located on different strands. Also, applying the 'strand specific' 'reverse' option in an RNA-seq run could allow the user to assess the degree of antisense transcription. Note that mate pairs are not supported when choosing the forward only or reverse only option.
- Specify in the next two dialog a target region for the analysis of the sample with the Indels and Structural Variants tool, first for the tumor sample, followed by the normal sample (figure 23.12).
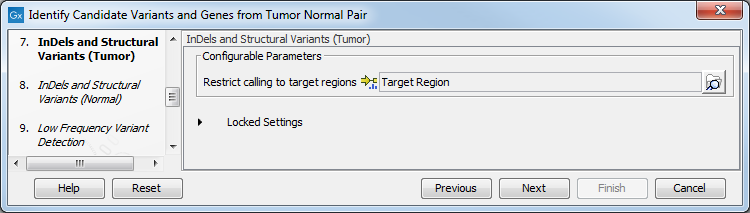
Figure 23.21: Specify the target region for the Indels and Structural Variants tool.The targeted region file is a file that specifies which regions have been sequenced. This file is something that you must provide yourself, as this file depends on the technology used for sequencing. You can obtain the targeted regions file from the vendor of your targeted sequencing reagents. Remember that you have a hg38-specific BED file when using hg38 as reference, and hg19-specific BED file when using hg19 as reference.
- Set the parameters for the Low Frequency Variant Detection step (see figure 23.22). For a description of the different parameters that can be adjusted in the variant detection step, see
http://resources.qiagenbioinformatics.com/manuals/clcgenomicsworkbench/current/index.php?manual=Low_Frequency_Variant_Detection.html.
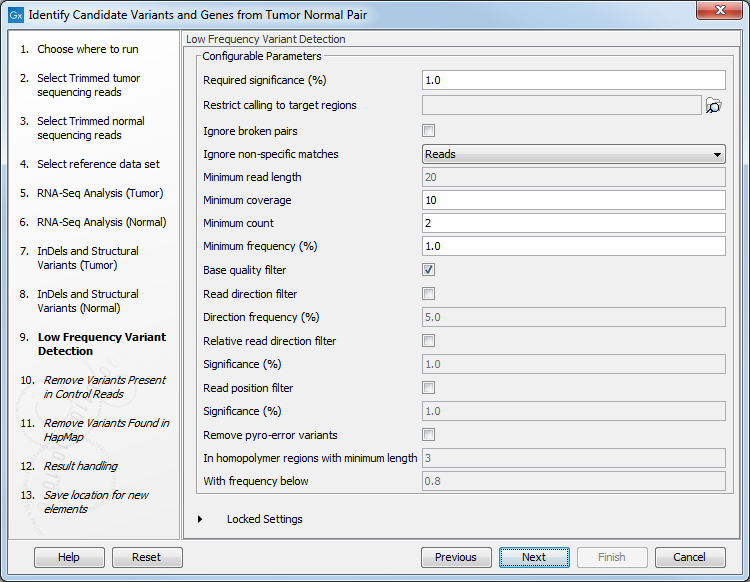
Figure 23.22: Specify the parameters for variant calling. - The next dialog called Remove Variants Present in Control Reads (figure 23.23) concerns removal of germline variants. You are asked to supply the number of reads in the control data set that should support the variant allele in order to include it as a match. All the variants where at least this number of control reads show the particular allele will be filtered away in the result track.
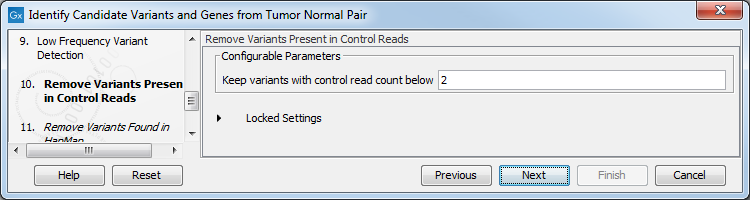
Figure 23.23: Specify the number of reads to use as cutoff for removal of germline variants. - Finally, for the Remove Variants Found in HapMap (figure 23.24), you can also specify which specific Hapmap population(s) characterize(s) best the samples.
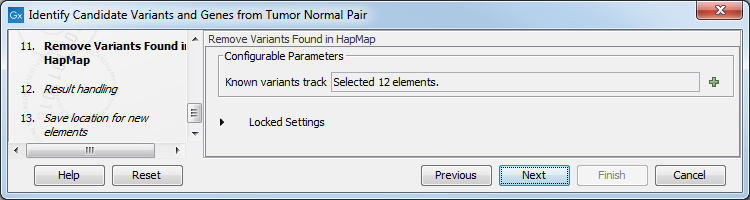
Figure 23.24: Remove Hapmap variants. - In the last wizard step you can check the selected settings by clicking on the button labeled Preview All Parameters.
In the Preview All Parameters wizard you can only check the settings, and if you wish to make changes you have to use the Previous button from the wizard to edit parameters in the relevant windows.
- Choose to Save your results and click on the button labeled Finish.
The following outputs are generated:
- Gene Expression Normal and Gene Expression Tumor (
 ) A track showing gene expression annotations. Hold the mouse over or right-click on the track: a tooltip will appear with information about e.g. gene name and gene expression values.
- Transcript Expression Normal and Transcript Expression Tumor () A track showing transcript expression annotations.
- RNA-Seq Mapping Report Normal and RNA-Seq Mapping Report Tumor (
 ) This report contains information about the reads, reference, transcripts, and statistics. This is explained in more detail in the CLC Workbench reference manual in section RNA-Seq report (http://resources.qiagenbioinformatics.com/manuals/clcgenomicsworkbench/current/index.php?manual=RNA_Seq_report.html).
- Read Mapping Normal and Read Mapping Tumor (
 ) The mapped RNA-seq reads. The RNA-seq reads are shown in different colors depending on their orientation, whether they are single reads or paired reads, and whether they map unambiguously (see http://resources.qiagenbioinformatics.com/manuals/clcgenomicsworkbench/current/index.php?manual=Coloring_mapped_reads.html).
- Differentially Expressed Genes file (
 ) A track showing the differentially expressed genes. The table view provides information about fold change, difference in expression, the maximum expression (observed in either the case or the control), the expression in the case, and the expression in the control.
- Variant Calling Report Tumor () Report showing error rates for quality categories, quality of examined sites, and estimated frequencies of actual to called bases for different quality score ranges.
- Annotated Somatic Variants with Expression Values (
 ) A variant track showing the somatic variants. When mousing over a variant, a tooltip will appear with information about the variant.
- Amino Acid Track
- Track List RNA-Seq Tumor_Normal Comparison (
 ) A collection of tracks presented together. Shows the annotated variant track together with the human reference sequence, genes, transcripts, coding regions, and variants detected in ClinVar and dbSNP Common (see figure 23.25).
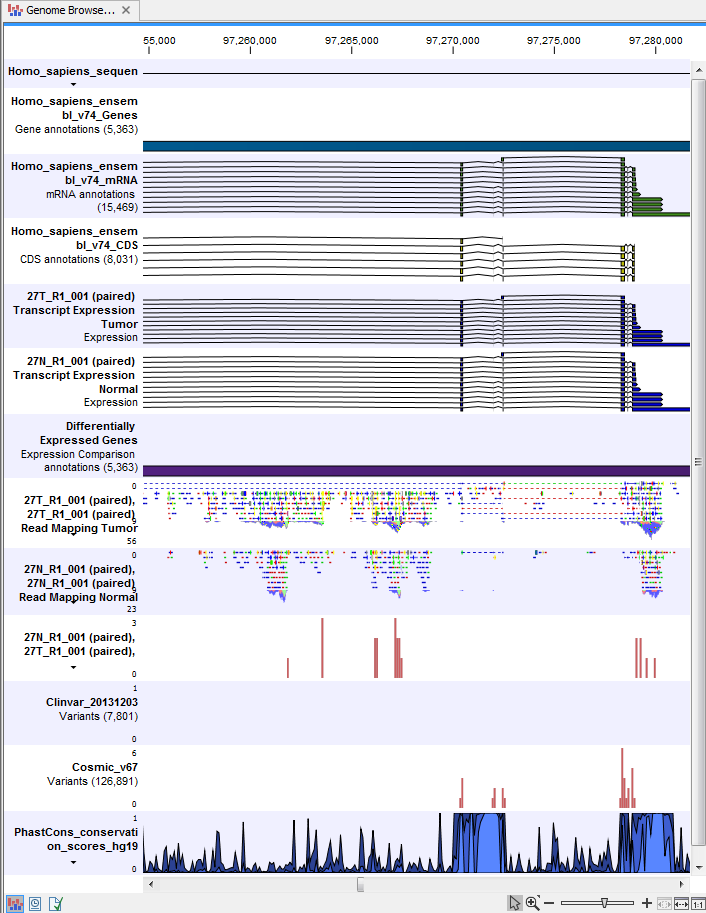
Figure 23.25: The Track List is a collection of tracks that makes it easy to compare them to each other. Each track kan be opened individually by double-clicking on the track name in the left side of the Track List view.