Target Region Coverage Analysis
The Target Region Coverage Analysis tool makes it easy to evaluate and compare multiple samples with respect to a given coverage metric. The tool takes as input one or more per-region statistics tracks generated by QC for Targeted Sequencing and outputs a target region track providing statistics across the analyzed samples. In addition, an overlay annotation track (for example a gene track) can be provided to obtain a higher-level summary, where target regions are grouped based on overlap, and coverage statistics are calculated for each group.
The QC for Targeted Sequencing tool is described in the CLC Genomics Workbench manual: https://resources.qiagenbioinformatics.com/manuals/clcgenomicsworkbench/current/index.php?manual=QC_Targeted_Sequencing.html.
Running the tool
To launch Target Region Coverage Analysis, go to:
Toolbox | Quality Control (![]() ) | Target Region Coverage Analysis (
) | Target Region Coverage Analysis (![]() )
)
In the first dialog (figure 24.24), select one or more per-region statistic tracks (![]() ) produced by QC for Targeted Sequencing.
The tracks must be based on the same target region track.
) produced by QC for Targeted Sequencing.
The tracks must be based on the same target region track.
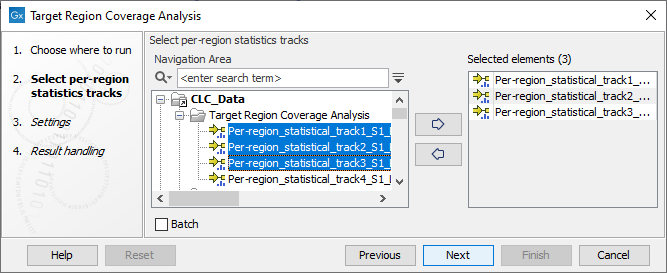
Figure 24.24: Select one or more per-region statistics tracks.
The next dialog allows you to configure the settings for this tool, as shown in figure 24.25 and described below.
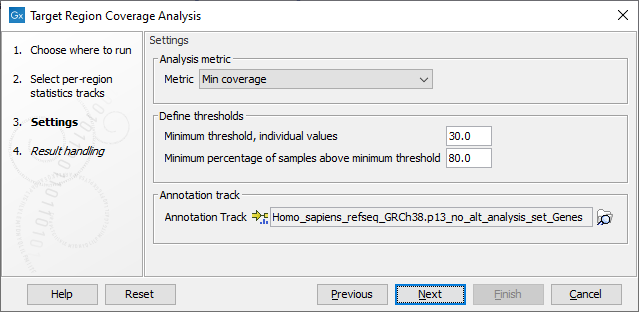
Figure 24.25: Settings of the Target Region Coverage Analysis tool.
- Metric: Metric column from the per-region statistics tracks for which the QC evaluation will be performed. The available metrics are: GC %, Min coverage, Max coverage, Mean coverage, Median coverage, Mean coverage (excluding zero coverage) and Median coverage (excluding zero coverage).
- Minimum threshold, individual values: Minimum threshold for the metric selected above. Each target region in each sample is evaluated separately, and must have at least this value to pass. Values that do not pass this criteria will be highlighted in the table view of the target region output track.
- Minimum percentage of samples above minimum threshold: The percentage of input samples that should pass the minimum threshold. The value is used to color code the target region output track and make it easier to see which target regions that pass the criteria across samples.
- Annotation track: The annotation track (
 ) is optional and can be a gene, CDS or mRNA track. If provided, an additional output is produced in which target regions are grouped based on the overlapping annotations. For example, if a gene track is selected, target regions are grouped per gene and the selected metric is combined and reported per gene.
Output from Target Region Coverage Analysis
Two outputs are produced from the Target Region Coverage Analysis tool:
- Target region coverage track: Target regions annotated with coverage metrics from the individual samples and statistics across all samples. In the table view, fields for which values did not pass the defined threshold will be highlighted. This makes it possible to quickly spot both poor samples that have multiple failing targets and poor target regions that fail across samples. The latter may be indicative of failing primers.
- Annotation coverage track: This output is produced only if an annotation track is provided. The track table view lists cross-sample statistics for each annotation (e.g. gene) that have at least one overlapping target region. Annotations with no overlapping target region are not displayed.
Target region coverage track
The target region coverage track includes the following annotations:
- Target region length: Length of the target region.
- Metric, min: Sample minimum of the selected metric observed for this target region.
- Metric, max: Sample maximum of the selected metric observed for this target region.
- Metric, mean: Sample mean of the selected metric observed for this target region.
- Metric, median: Sample median of the selected metric observed for this target region.
- Metric, std dev: Sample standard deviation of the selected metric observed for this target region.
- Percentage of samples passing threshold: Percentage of samples for which the metric is equal to or above the threshold.
- Individual per-region statistics track metrics: One column per input track with the individual sample metrics.
- Annotation column: Overlapping annotation (Gene, CDS, mRNA). This column is only present if an annotation track was provided.
Annotation coverage track
The annotation coverage track provides combined statistics for target regions overlapping the same annotation region. If the target regions correspond to exons and a gene track is selected as annotation track, all exons within a gene are combined and statistics are reported per gene. For each sample, the metric values from overlapping target regions are combined to a single metric value. The selected metric dictates how values are combined: Min coverage values are combined by taking the minimum, Max coverage values are combined by taking that maximum and Mean coverage and GC% values are combined as a weighted average, where each target region is weighted by its length. Median coverage values are combined by calculating the median of the values, however, it should be noted that this is different from calculating the median of all base position coverage values contained in the set of target regions.The annotation coverage track includes the following annotations:
- Target regions: Number of overlapping target regions.
- Target region length: Cumulative length of overlapping target regions.
- Metric, min: Sample minimum of the selected metric observed for this annotation region.
- Metric, max: Sample maximum of the selected metric observed for this annotation region.
- Metric, mean: Sample mean of the selected metric observed for this annotation region.
- Metric, median: Sample median of the selected metric observed for this annotation region.
- Metric, std dev: Sample standard deviation of the selected metric observed for this annotation region.