Immune Repertoire Analysis
Using RNA sequencing data as input, the Immune Repertoire Analysis tool can be used to characterize the T cell receptor repertoire.
To run the tool, T cell receptor reference data for V- and J genes and a trim adapter list containing a list of constant (C) regions for all chain types is needed. This data is available in the Reference Data Library provided by QIAGEN.
To download the reference data, open the Reference Data Manager by clicking on the References button, located on the right hand side of the Workbench toolbar.
Click on the "QIAGEN Sets" tab in the Reference Data Manager. For analysis of human data, select the Reference Data Set called "QIAseq Immune Repertoire Analysis IMGT Reference Sequences". For analysis of mouse data, select the Reference Data Set called "QIAseq Immune Repertoire Analysis Mouse IMGT Reference Sequences".
See section http://resources.qiagenbioinformatics.com/manuals/clcgenomicsworkbench/current/index.php?manual=QIAGEN_Sets.html for further information about downloading QIAGEN reference data sets using the Reference Data Manager.
Note: Before analyzing RNA sequencing data, the constant region must be trimmed off the reads using the Trim Reads tool and the relevant trim adapter list. Two trim adapter list containing sequences for the constant regions of the T cell receptor are provided: one for human data (homo_sapiens_tcr_constant_trimming) and one for mouse data (mus_musculus_tcr_constant_trimming). Details about the Trim Reads tool can be found at http://resources.qiagenbioinformatics.com/manuals/clcgenomicsworkbench/current/index.php?manual=Trim_Reads.html.
To run Immune Repertoire Analysis go to the Toolbox and select:
Tools | QIAseq Panel Expert Tools (![]() ) | QIAseq Immune Repertoire Expert Tools (
) | QIAseq Immune Repertoire Expert Tools (![]() ) | Immune Repertoire Analysis (
) | Immune Repertoire Analysis (![]() )
)
This opens a dialog where the RNA sequencing reads to analyze can be selected. These reads must already have been trimmed to remove the constant (C) region from the reads, as described above.
When the trimmed RNA reads have been selected, click Next to get to the step shown in figure 8.2, where most of the configuration is done.
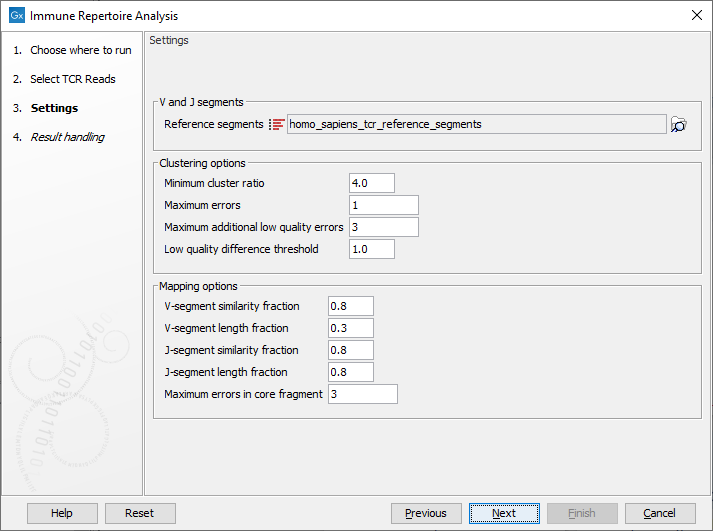
Figure 8.2: This dialog allows selection of TCR reference sequences as well as adjustment of the clustering and mapping options.
The options available are:
V and J segments
- Reference segments Here the relevant reference data can be selected:
homo_sapiens_tcr_reference_segments for human data or mus_musculus_tcr_reference_segments for mouse data. The reference data is provided by QIAGEN and when downloaded they can be found in the CLC_Refereces folder in a subfolder under homo_sapiens, tcr_reference_segments and qiaseq_immune_v1 or mus_musculus, tcr_reference_segments and qiaseq_immune_v1_mm.
Click on the button labeled Next to run the analysis with default settings. Alternatively, the following options are available for adjustments:
Clustering options
- Minimum cluster ratio When merging two clonotypes the number of reads associated with the larger clonotype should have at least this number times the number of reads in the smaller clonotype.
E.g. if the minimum cluster ratio is 4 and a clonotype has 8 reads, only clonotypes with at most 2 (8 / 4 = 2) reads will be considered for merging.
- Maximum errors Two clonotypes will be considered for merging if there is at most this number of differences between their CDR3 sequences at the nucleotide level.
- Maximum additional low quality errors Two clonotypes where the number of differences between their CDR3 sequences exceeds ``Maximum errors'' can still be considered for merging, if the number of additional errors does not exceed this number and the additional errors occur at positions with low quality in the smaller clonotype.
See ``Low quality difference threshold'' for definition of low quality positions.
- Low quality difference threshold A position is considered of low quality if the average quality of the position is more than this number of standard deviations lower than the average quality at each position in the CDR3 sequence.
Mapping options
- V segment similarity fraction
The minimum identity fraction between the aligned region of the read and the V-segment reference sequence.
- V-segment length fraction
Minimum fraction of the read that must match the V-segment reference sequence.
The read is expected to contain both V,J and optionally D segment sequence as well as random nucleotides at the junctions.
The fraction of the read made up by the V segment is expected to be considerably smaller than one.
- J-segment similarity fraction
The minimum identity fraction between the aligned region of the read and the J-segment reference sequence.
- J-segment length fraction
Minimum fraction of the J-segment reference sequence that must match the read.
Note that this fraction is relative to the segment, not relative to the read as in the V-segment length fraction parameter.
If the read is expected to cover the whole J segment sequence, the value can be set close to one.
- Maximum errors in core fragment The maximum number of errors allowed in the 15 bp core fragment used for finding segment candidates for full pairwise alignment.
Output from the Immune Repertoire Analysis tool
Two different outputs are produced from the Immune Repertoire Analysis tool:
- TCR analysis report A report that summarizes statistics of the detected T cell repertoire
- Clonotypes A table presenting chain type, V- and J gene segment, CDR3 nucleotide sequence and length, CDR3 amino acid sequence, count and a column indicating whether the detected sequence is productive or not.
TCR analysis report
The TCR analysis report includes the following information:
- Summary A summary table showing the total number of input reads along with information about how many reads were successfully clonotyped, which chain type the reads belong to, and the number of unique clonotypes before and after merging.
- Diversity indices For each chain type there is a table containing diversity indices.
It is likely that some rare clonotypes are missing in the sequencing data,
the extrapolated diversity indices gives a projection of how many additional clonotypes there are
and what the diversity would have been if the sample had been sequenced deep enough to represent all clonotypes.
- Total number: The number of different clonotypes detected.
- Extrapolated diversity (chaoE): The extrapolated number of detected clonotypes by the method described in [Chao, 1987].
- Lorenz curve at 50% of total: The percent of clonotypes that account for 50% of the total read count. Also sometimes denoted as D50.
- Inverse Simpson's index: Let
 denote the read count for the
  th clonotype and let
 .
Then the inverse Simpon's index is defined as:
.
Then the inverse Simpon's index is defined as:

- Extrapolated Inverse Simpson's index (chaoE): The extrapolated inverse Simpson's index by the method described in [Chao et al., 2014].
- Shannon-Wiener index: With and
 defined as above, the Shannon-Wiener index is defined as:

Note that the logarithm is the natural logarithm. To convert to base 2 logarithm the index can be multiplied by

- Extrapolated Shannon-Wiener index (chaoE): The extrapolated Shannon-Wiener index by the method described in [Chao et al., 2013].
- Total number: The number of different clonotypes detected.
- CDR3 length A plot for each chain type shows the length distribution of the CDR3 nucleotide sequences.
Peaks are expected every 3 nt. due to repertoires consisting predominantly of in-frame CDR3 sequences, see figure 8.3.
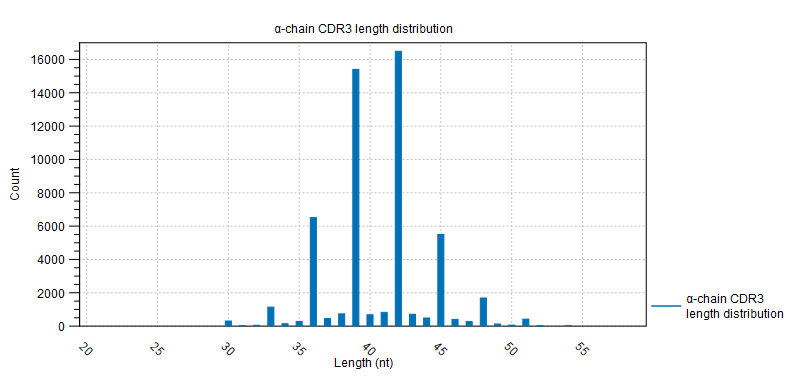
Figure 8.3: CDR3 length distribution plot for the alpha-chain with peaks every 3 nt. - V and J usage Histograms for each chain and segment type showing the frequency of each of the detected V- and J segments, respectively.
Double clicking the plot, opens the plot in a new window.
A table view can be selected from the bottom pane, showing counts for all segments, see figure 8.4.
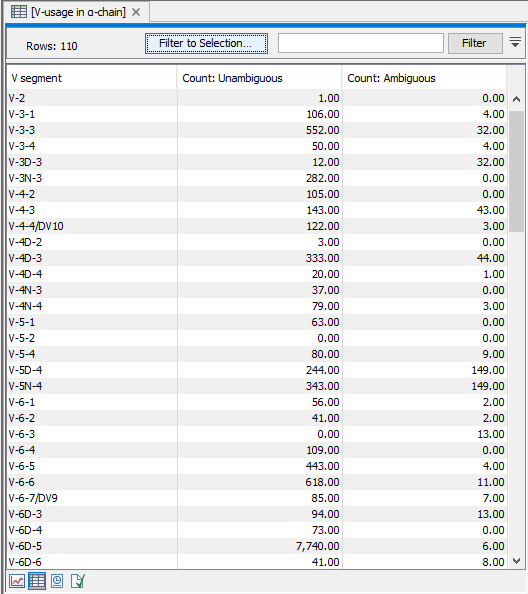
Figure 8.4: A full table showing segment usage can be obtained by double clicking the segment usage plot and selecting table view. - Cumulative frequencies of clonotypes A plot for each chain type shows the cumulative frequencies of the identified clonotypes ordered by descending read count.
If the curve is steep in the beginning and then flattens, this indicates that a few clonotypes accounts for most the reads.
If the curve on the other hand is more linear, this indicates a more even distribution of reads among the clonotypes.
- Productive summary The percentage distribution for each chain type of CDR3 nucleotide sequences that are productive, out-of-frame or contain a premature stop codon
Clonotypes table
The Clonotypes table includes the following columns:- Chain:
Which of the four gene families
 ,
,  ,
,  ,
,  the clonotype belongs to.
To ease filtering the families are denoted TRA, TRB, TRG and TRD respectively.
the clonotype belongs to.
To ease filtering the families are denoted TRA, TRB, TRG and TRD respectively.
- V: The identified V reference segment(s). If a single unambiguous V segment could not be identified, the V segments will be listed separated by a comma.
- J: The identified J reference segment(s). If a single unambiguous J segment could not be identified, the J segments will be listed separated by a comma.
- CDR3 nucleotide sequence: The nucleotide sequence for CDR3 including the V- and J region-encoded conserved motifs
- CDR3 amino acid sequence: The translated amino acid sequence for the CDR3 nucleotide sequence provided that it is in-frame.
- CDR3 length: The length of the CDR3 nucleotide sequence.
- Count: The number of times the specific CDR3 sequence was detected.
- Productive: One of three categories are used to characterize the CDR3 nucleotide sequences; Productive are sequences that are in frame and do not contain a premature stop codon; Out-of-frame are sequences that have a length that is not a multiple of three; Premature stop codon are sequences that contain an in-frame stop codon that results in the coding of a stop codon prematurely.
Note All plots can be opened in table view by double-clicking on the plot and clicking on the table icon in the lower left corner.