SNP tree
The SNP tree can be vizualized in Tree view (![]() ), Table view (
), Table view (![]() ), and SNP Tree Variants view (
), and SNP Tree Variants view (![]() ).
).
Tree view (![]() )
)
The SNP tree layout, node and label settings is adjusted from the Tree Settings Side Panel found in the left side of the view area. For details about the settings, see https://resources.qiagenbioinformatics.com/manuals/clcgenomicsworkbench/current/index.php?manual=Tree_Settings.html.
If a Result Metadata Table was provided as input, it is possible to decorate the SNP tree with one or more metadata layers from the Side Panel section Metadata, see https://resources.qiagenbioinformatics.com/manuals/clcgenomicsworkbench/current/index.php?manual=Visualizing_metadata.html. This enables visual identification of potential correlation between samples, metadata layers, and tree typology (figure 9.8).
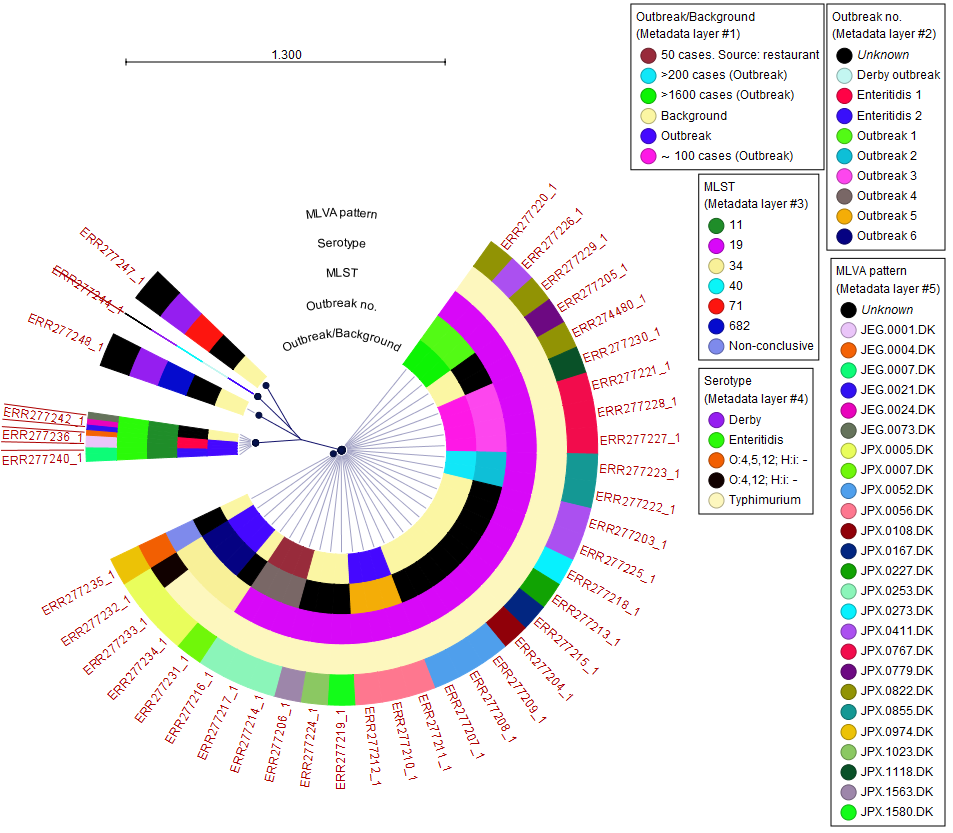
Figure 9.8: Visualization of SNP tree including selected metadata and analysis result metadata.
SNP Tree Variants view (![]() )
)
With the SNP Tree Variants view it is possible to inspect the variants relating to a given internal node in the SNP tree. To populate the table with the SNPs of interest, first select the internal node of interest in the Tree view and then go to the SNP Tree Variants (![]() ) view (figure 9.9).
) view (figure 9.9).
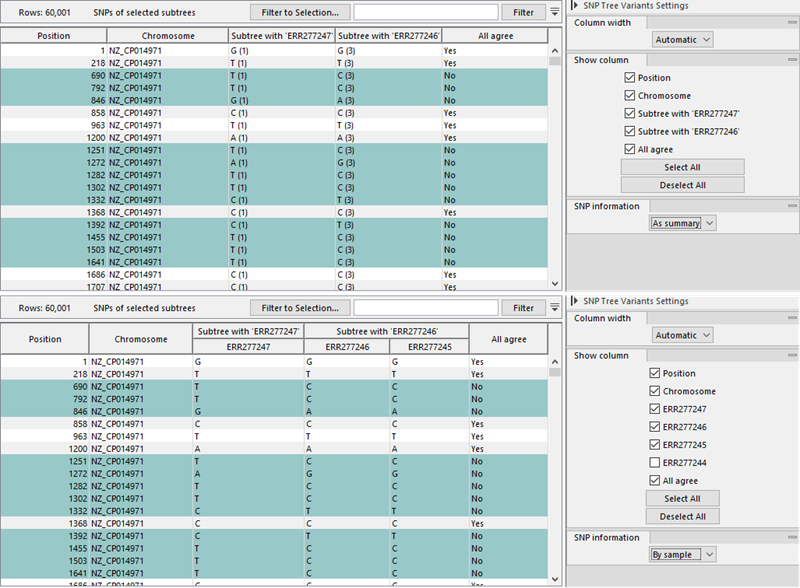
Figure 9.9: Counts of differences at a given position in the branches of the selected internal node. Top: SNP information As summary. Bottom: SNP information By sample.
The table lists the following columns:
- Position. The position of the SNP on the reference chromosome
- Chromosome. The name of the reference chromosome.
- All agree. Yes/No indicates whether all samples belonging to the internal node have the same variant allele.
With the Side Panel section SNP information you can choose to have SNP information presented As summary or By sample:
- As summary. The table contains one column per subtree with a summary of alleles in the subtree samples e.g., "A (3), G (1)" (figure 9.9 - top image).
- By sample. The table contains one column per sample with sample-specific alleles (figure 9.9 - bottom image).