Resistance abundance table
The Resistance abundance table summarizes the abundance of each marker, i.e., it reports the number of times a given marker is found in the input reads. The abundance is also reported in units of RPKM, referred to as the normalized abundance, which are calculated in the same way as is done by ShortBRED-Quantify. It is possible to aggregate the abundance by gene name and resistance phenotype to get the abundance at each of these levels. The table can be visualized using the Stacked bar charts and Stacked area charts function, as well as the Sunburst charts.
- Table view (
 ) (figure 13.6)
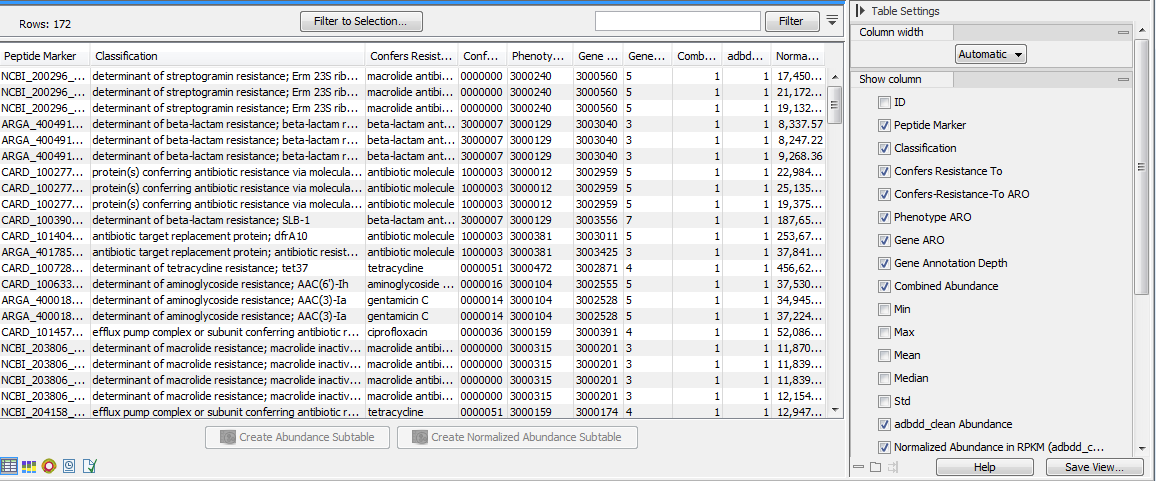
Figure 13.6: Resistance abundance table.The table displays the following columns (note that the columns can vary depending on the marker database used):
- ID: internal ID which the abundance tables use for ordering the samples. IDs are unique, so that when merging abundance tables peptide markers with the same ID will be combined.
- Peptide Marker: the name of the Peptide Marker as it is given in the AR marker database.
- Classification: the Classification of the peptide marker contains the resistance phenotype and the gene name separated by a semi-colon.
- Confers Resistance To: the antibiotic class which this marker confers resistance to.
- Confers-Resistance-To ARO: the ARO (Antibiotic Resistance Ontology) ID number of the "Confers-Resistance-To" property.
- Phenotype ARO: the ARO ID number associated with this particular resistance phenotype.
- Gene ARO: the ARO ID number associated with this particular gene.
- Gene Annotation Depth: the number of parents in the gene annotation graph in the Antibiotic Resistance Ontology. This indicates the specificity of the annotation. The higher the number, the more specific the annotation is.
- Combined Abundance: reports the number of times a given marker is found in the input reads across all samples.
- Min, Max, Mean, Median and Std: respectively minimum, maximum, mean, median and standard deviation of the number of reads for the taxa across all samples.
- Name of the sample Abundance (for example SRR2754560 in the table above): number of reads containing this peptide marker for each sample.
- Normalized Abundance in RPKM (name of the sample): Normalized Abundance is reported in units of RPKM (Reads Per Kilobase per Million reads) which are calculated in the same way as is done by ShortBRED-Quantify.
In the right side panel, under the tab Data, you can switch between raw and relative abundances. You can also combine absolute counts and relative abundances by Phenotype and Gene name by selecting the appropriate level in the Aggregate feature drop-down menu. Incomplete fatures at a given level of Aggregation can be hidden using the "Hide incomplete features" check box.
Finally, if you have previously annotated your table with Metadata (see section 7.9), you can Aggregate sample by the groups previously defined in your metadata table. This is useful when for example analyzing replicates from the same sample origin.
Above and under the table, the following actions are available:
- Filter to Selection... to have the table only displaying pre-selected rows in the table.
- Create Abundance Subtable will create a table containing only the selected rows.
- Create Normalized Abundance Subtable will create a table with all rows normalized on the values of a single selected row. The row used for normalization will disappear from the new abundance table. The normalization scales the abundance table linearly, where the scaling factor is calculated by determining the average abundance across all samples and for each sample scale it to the average for the reference. If you have zero values in some samples for the control, you will need to generate a new abundance table where these samples are not present. If the abundance table is obtained from merging single-sample abundance tables, then the merge should be redone excluding the samples with zero control read counts.
- ID: internal ID which the abundance tables use for ordering the samples. IDs are unique, so that when merging abundance tables peptide markers with the same ID will be combined.
- Stacked Bar Chart and Stacked Area Chart (
 )
)
Choose which chart you want to see using the drop down menu in the upper right corner of the side panel. The charts can be scaled by percentage, where all bars have the same height of 100%, or counts, where the bar heights are proportional to the number of counts. In the Stacked Bar (figure 13.7) and Stacked Area Charts (figure 13.8), the metadata can be used to aggregate groups of columns (samples) by selecting the relevant metadata category in the right hand side panel. Also, the data can be aggregated at any classification level selected. The relevant data points will automatically be summed accordingly.
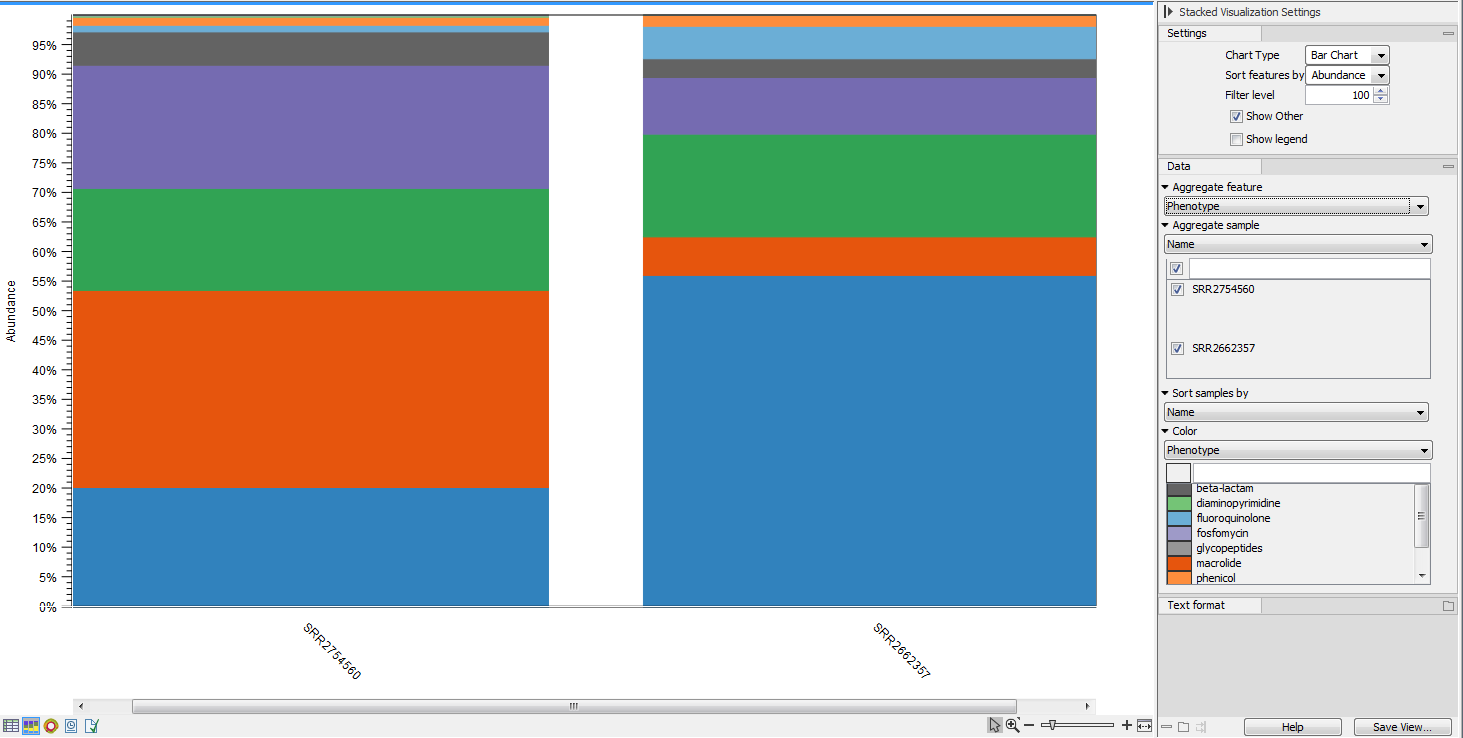
Figure 13.7: Stacked bar chart.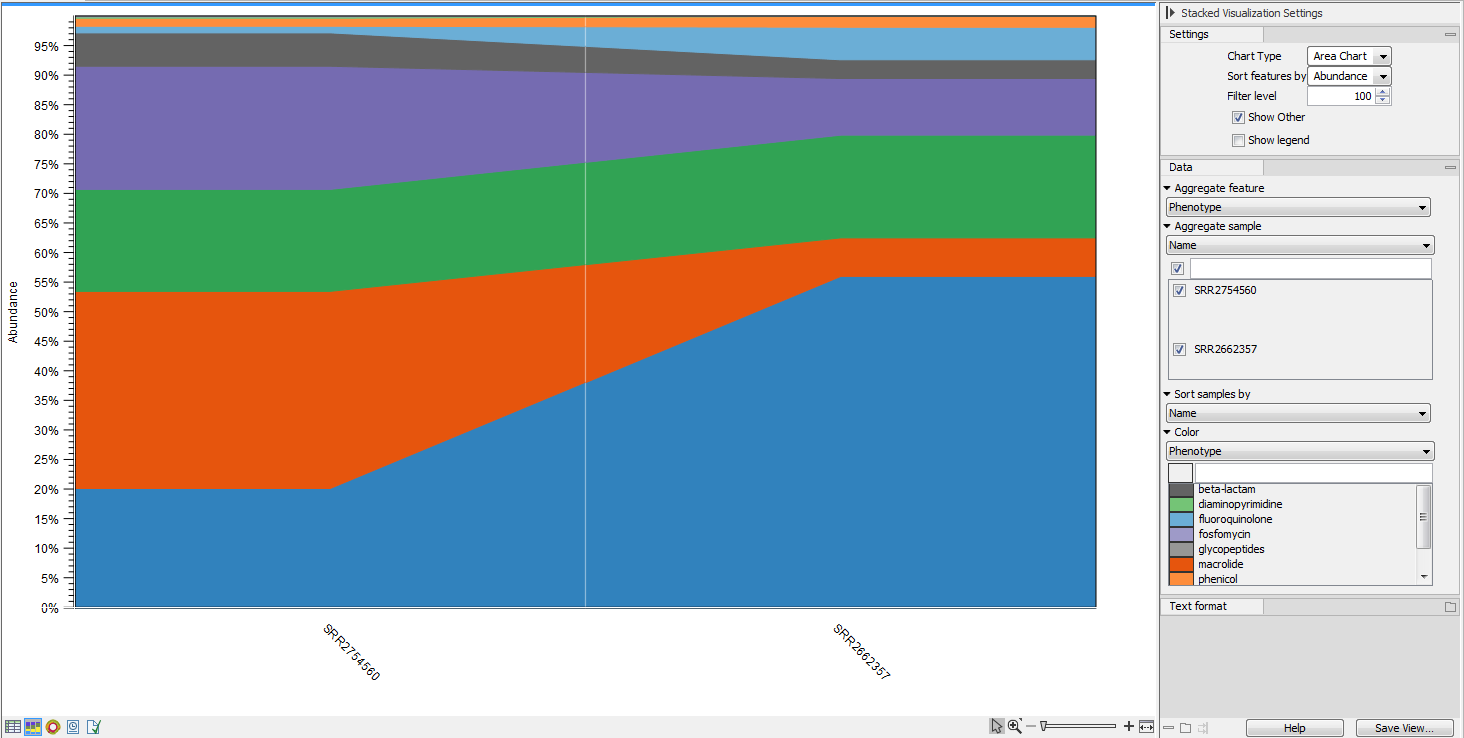
Figure 13.8: Stacked area chart.Holding the pointer over a colored area in any of the plots will result in the display of the corresponding classification label and counts. Filter level allows to modify the number of features to be shown in the plot. For example, setting the value to 10 means that the 10 most abundant features of each sample will be shown in all columns. The remaining features are grouped into "Other", and will be shown if the option is selected in the right hand side panel. One can select which classification level to color, and change the default colors manually. Colors can be specified at the same classification level as the one used to aggregate the data or at a lower level. When lower classification levels are chosen in the data aggregation field, the color will be inherited in alternating shadings. It is also possible to sort samples by metadata attributes, and to show groups of samples without collapsing their stacks, as well as change the label of each stack or group of stacks. Features can be sorted by "abundance" or "name" using the drop down menu in the right hand side panel. Using the bottom right-most button (Save/restore settings (
 )), the settings can be saved and applied in other plots, allowing visual comparisons across analyses.
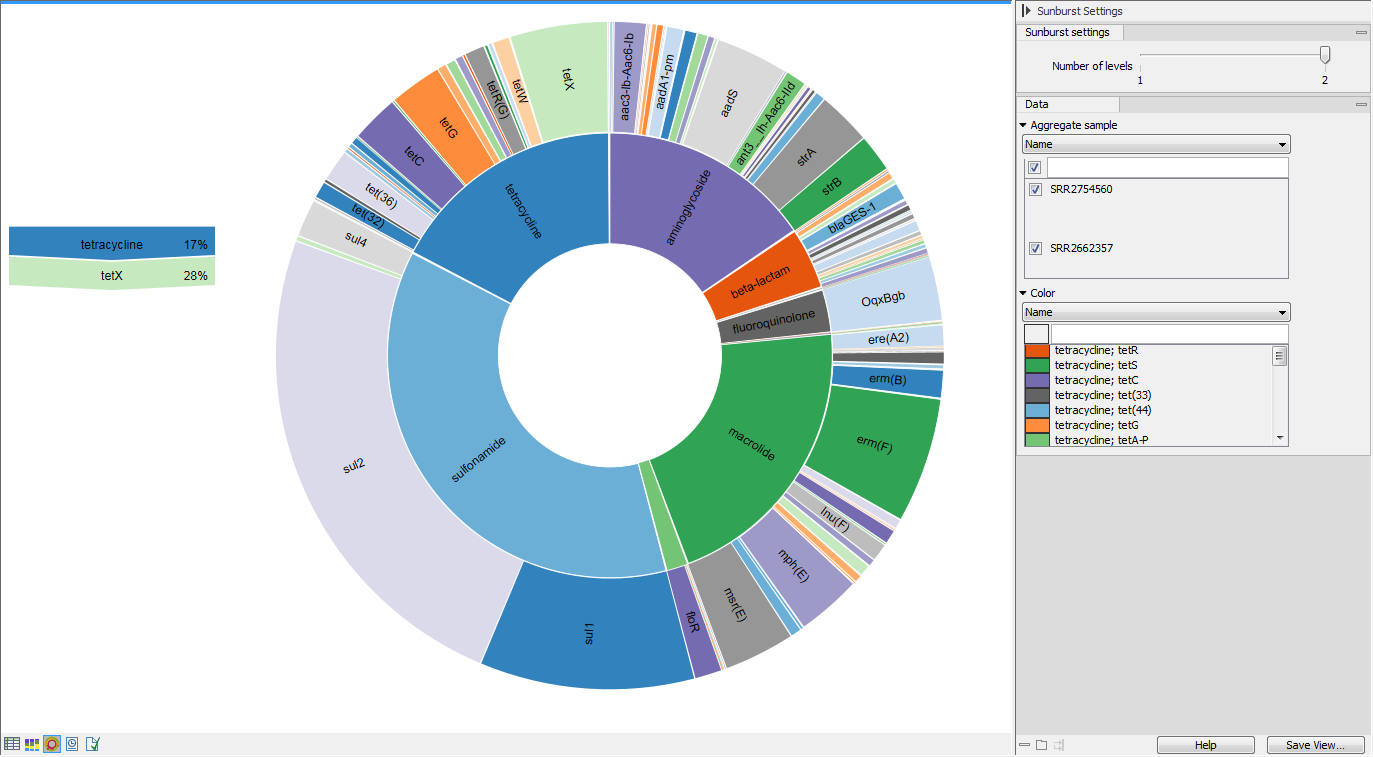
- Zoomable Sunbursts (
 )
The Zoomable Sunburst viewer lets the user select how many classification level
counts to display, and which level to color. Lower levels will inherit the
color in alternating shadings. Classification and relative abundances are displayed in a legend to the left
of the plot when hovering over the sunburst viewer with the mouse. The metadata
can be used to select which sample or group of samples to show in the sunburst
(figure 13.9).
)
The Zoomable Sunburst viewer lets the user select how many classification level
counts to display, and which level to color. Lower levels will inherit the
color in alternating shadings. Classification and relative abundances are displayed in a legend to the left
of the plot when hovering over the sunburst viewer with the mouse. The metadata
can be used to select which sample or group of samples to show in the sunburst
(figure 13.9).
Clicking on a lower level field will render that field the center of the plot and display lower level counts in a radial view. Clicking on the center field will render the level above the current view the center of the view.