Classify Long Read Amplicons output
The tool outputs an abundance table. In addition, the following outputs are available in the final wizard step (figure 4.22):
- Collect unmapped reads. Outputs a sequence list with all the reads that could not be mapped to the reference database.
- Create report. Outputs a summary report.
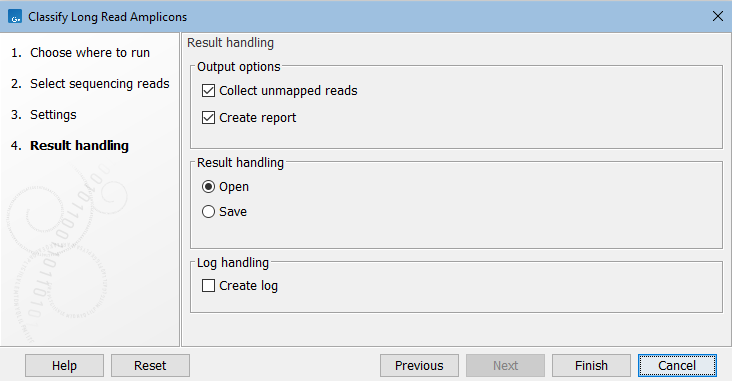
Figure 4.22: Classify Long Read Amplicons output options.
The Classify Long Read Amplicons abundance table
The abundance table output by Classify Long Read Amplicons contains a list of the identified taxonomies that passed the minimum coverage threshold, and the abundance assigned to each taxonomy. Given the probabilistic nature of the algorithm, the reported abundance is not equivalent to a read count, but rather it represents an estimated abundance. The estimate can contain fractions of reads, but the final reported abundance is rounded to the nearest integer.
In contrast to OTU or ASV abundance tables, Classify Long Read Amplicons abundance tables do not contain a sequence for the taxonomies. This is because the reads are not assigned to a sequence but to a taxonomy. Multiple reference sequences may have the same taxonomy (depending on the provided reference database), so all reads assigned to any of the sequences will count towards the abundance for the taxonomy.
Otherwise, the abundance table contains the same columns, views, and options as the OTU abundance table. See The OTU abundance table for a detailed description of the abundance table options.
The Classify Long Read Amplicons report
An example report can be seen in figure 4.23.
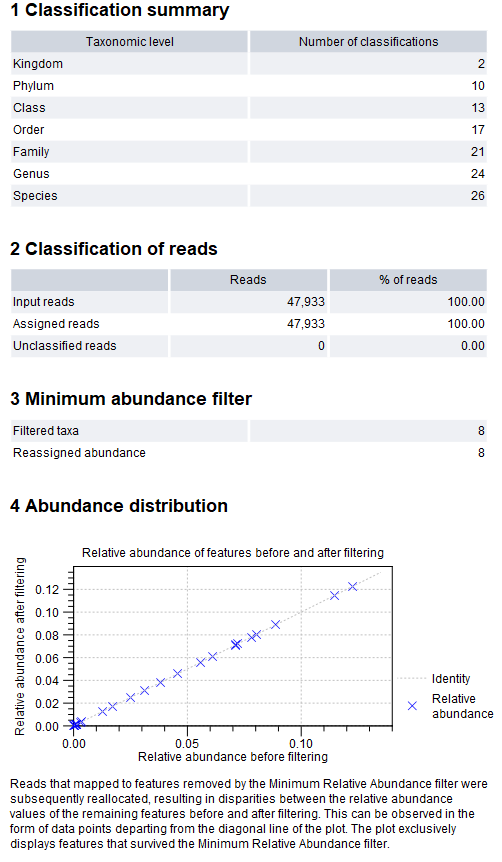
Figure 4.23: Classify Long Read Amplicons report.
The report contains summary statistics of the results, which can be used for quality checking and verification. It is divided into four sections:
- Classification summary. Number of unique taxonomic level reported for each taxonomic level.
- Classification of reads. Statistics of the classification given in number of reads and in percentage of input reads.
- Input reads. The number of reads in the input sequence list(s).
- Assigned reads. The number of reads that could be mapped to the reference database.
- Unclassified reads. The number of reads that could not be mapped to the reference database. If a large percentage of the reads are unclassified, it could mean that the sample is contaminated, or that the reference database is not comprehensive enough.
- Minimum abundance filter.
- Filtered taxa. The number of taxa removed from the final result due to having relative abundance below the minimum abundance threshold.
- Reassigned abundance. The sum of the abundance of the removed taxa which has been reassigned to the most likely taxa among the retained taxa.
- Abundance distribution. A scatter plot of the relative abundance of reported features before and after reassigning abundance of features below the minimum abundance threshold. Points will fall on the line or above it, but if one or a few point(s) lie significantly higher than the line, it could mean that that feature has been artificially inflated in the abundance table.