Taxonomic profiling abundance table
The abundance table (see an example in figure 5.4) displays the names of the identified taxons (assemblies), along with their full taxonomy, a coverage estimate, the total amount of reads found in the sample that are associated with this taxon and the confidence score for the taxonomic assignment. The table can be visualized using the Stacked bar charts and Stacked area charts function, as well as the Sunburst charts.
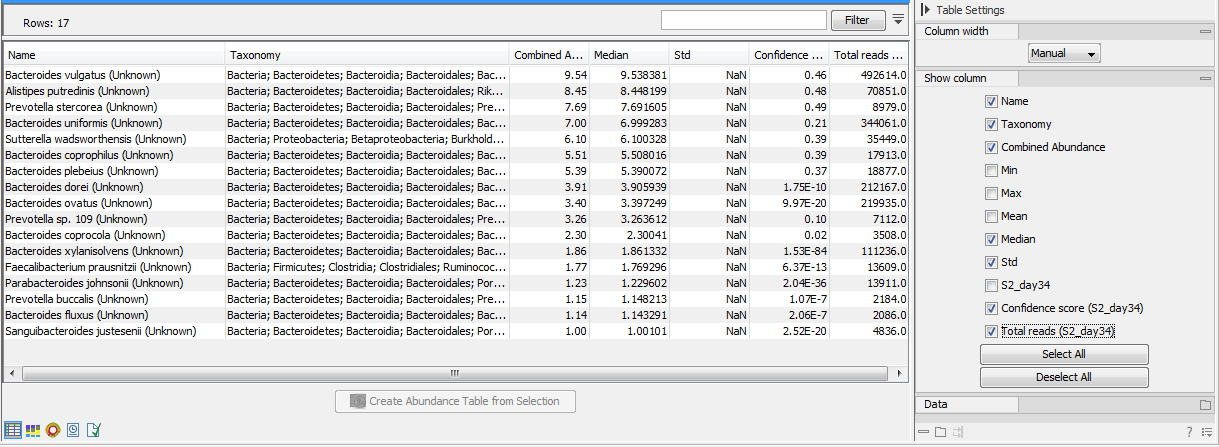
Figure 5.4: An abundance table generated by the Taxonomic Profiling tool.
- Table view (
 )
The table displays the following columns:
)
The table displays the following columns:
- Name The name of the taxon, specified by the reference database or the NCBI taxonomy. If the name contains the text "(Unknown)", it indicates that this taxon corresponds to a higher-level node in the taxonomy, and that this node had a significant amount of coverage associated to ancestor taxons that are present in the database but were disqualified. This indicates that there was some organism in the sample for which there is no exactly matching reference in the database, but is most likely closely related to this taxon. If the name does not contain the text "(Unknown)", it means that the sample contains this exact taxon, which is present in the database.
- Taxonomy The taxonomy of the taxon, as specified by the reference database.
- Assembly ID The id of the assembly (typically genbank assembly accession numbers), as specified by the reference database.
- Combined Abundance The coverage of the species across all samples.
- Min Minimum coverage across all samples
- Max Maximum coverage across all samples
- Mean Mean coverage of all samples
- Median Median coverage of all samples
- Std Standard deviation of the coverage across of all samples
- Abundance for each sample The estimated abundance of the taxon in a specific sample (calculated during the quantification phase, see Taxonomic Profiling).
- Confidence score for each sample A score between 0 (low confidence) and 1 (high confidence) indicating the confidence in the taxon being present in the sample.
- Total reads for each sample An estimate of the number of reads in the sample originating from the taxon.
Under the tab Data in the right side panel, you can switch between raw and relative abundances (relative abundances are computed as the ratio between the coverage of a taxon in a specific sample and the amount of coverage in the sample). You can also combine absolute counts and relative abundances by taxonomic levels by selecting the appropriate taxonomic level in the Aggregate feature drop-down menu. Finally, if you have previously annotated your table with Metadata (see section 7.7), you can Aggregate sample by the groups previously defined in your metadata table. This is useful when for example analyzing replicates from the same sample origin.
- Stacked Bar Chart and Stacked Area Chart (
 )
Choose which chart you want to see using the drop down menu in the upper right corner of the side panel. In the Stacked Bar (figure 5.5) and Stacked Area Charts (figure 5.6), the metadata can be used to aggregate groups of columns (samples) by selecting the relevant metadata category in the right hand side panel. Also, the data can be aggregated at any taxonomy level selected. The relevant data points will automatically be summed accordingly.
)
Choose which chart you want to see using the drop down menu in the upper right corner of the side panel. In the Stacked Bar (figure 5.5) and Stacked Area Charts (figure 5.6), the metadata can be used to aggregate groups of columns (samples) by selecting the relevant metadata category in the right hand side panel. Also, the data can be aggregated at any taxonomy level selected. The relevant data points will automatically be summed accordingly.
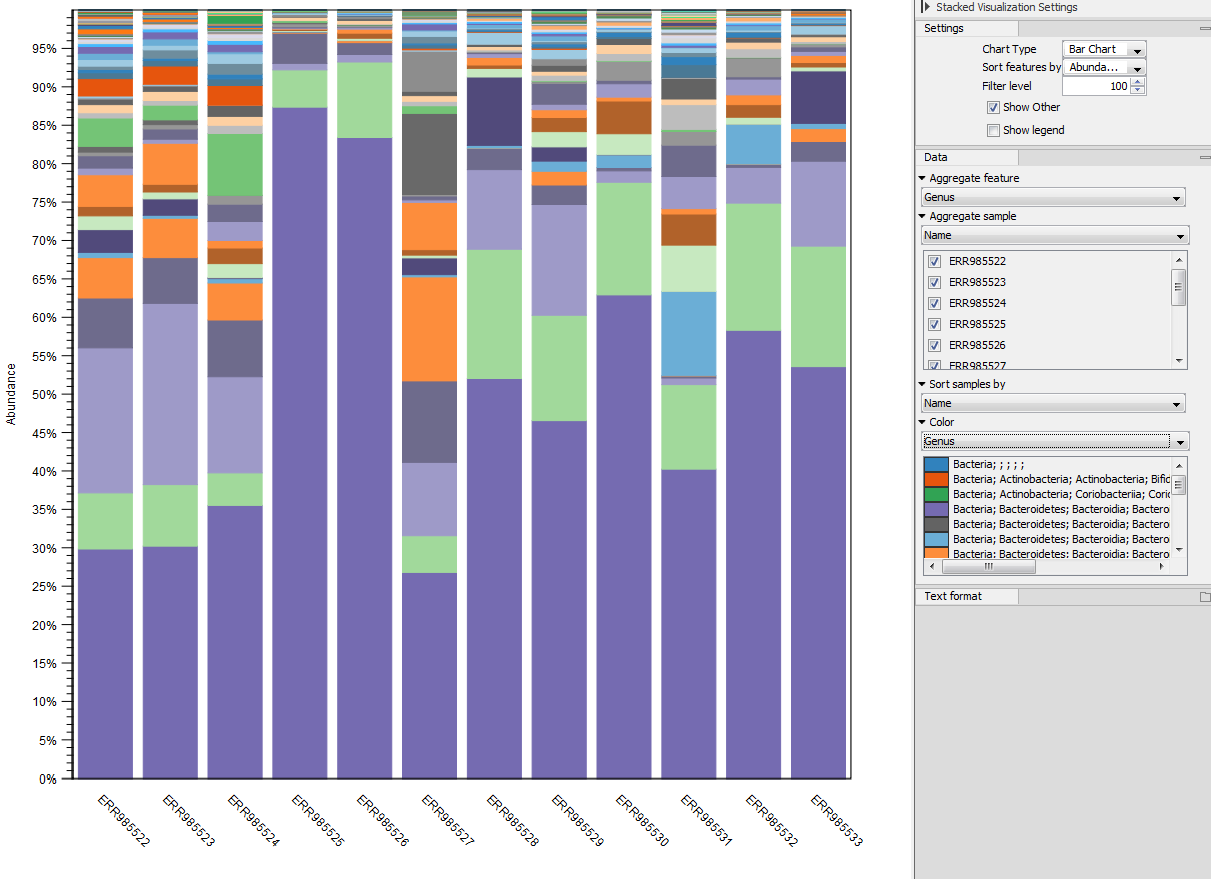
Figure 5.5: Stacked bar chart.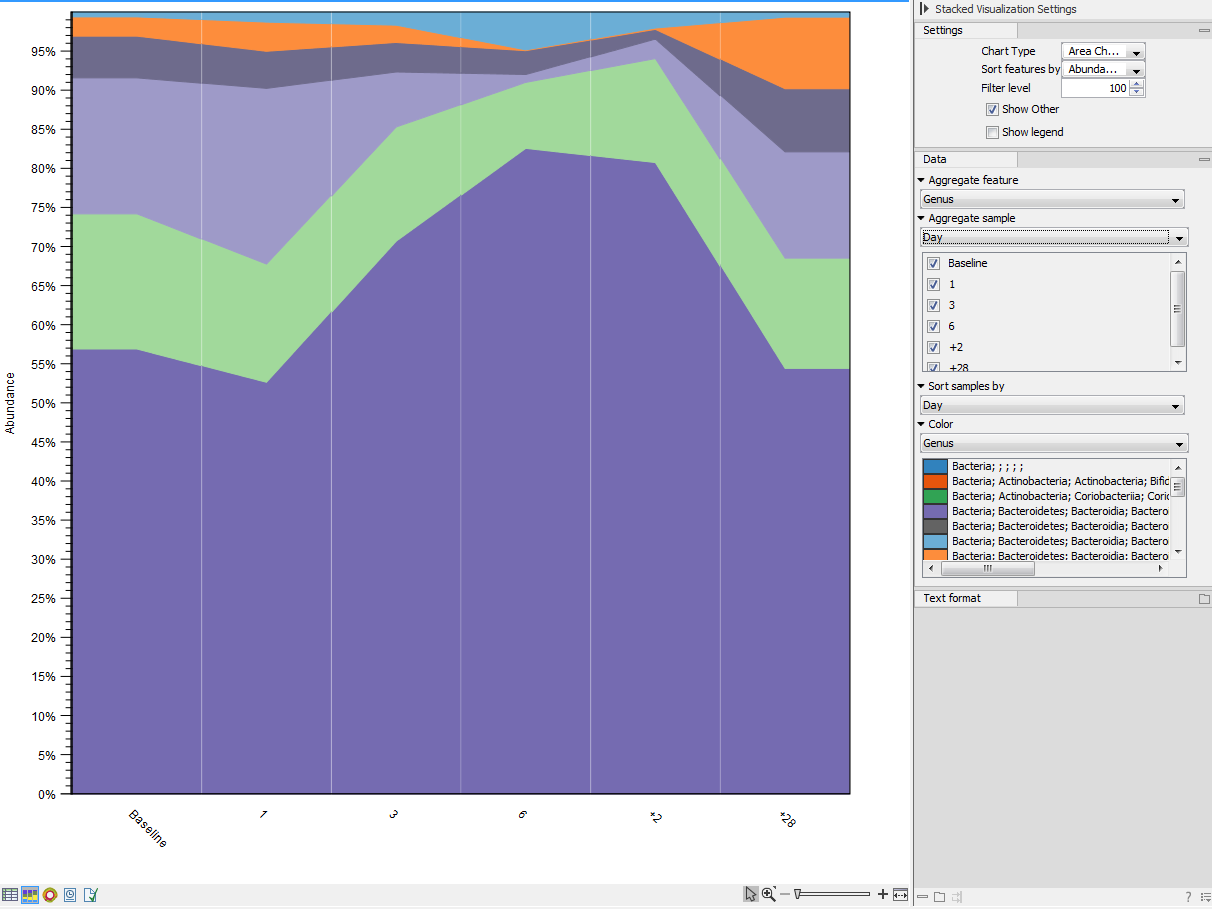
Figure 5.6: Stacked area chart.Holding the pointer over a colored area in any of the plots will result in the display of the corresponding taxonomy label and counts. Filter level allows to modify the number of features to be shown in the plot. For example, setting the value to 10 means that the 10 most abundant features of each sample will be shown in all columns. The remaining features are grouped into "Other", and will be shown if the option is selected in the right hand side panel. One can select which taxonomy level to color, and change the default colors manually. Colors can be specified at the same taxonomy level as the one used to aggregate the data or at a lower level. When lower taxonomy levels are chosen in the data aggregation field, the color will be inherited in alternating shadings. It is also possible to sort samples by metadata attributes, and to show groups of samples without collapsing their stacks, as well as change the label of each stack or group of stacks. Features can be sorted by "abundance" or "name" using the drop down menu in the right hand side panel. Using the bottom right-most button (Save/restore settings (
 )), the settings can be saved and applied in other plots, allowing visual comparisons across analyses.
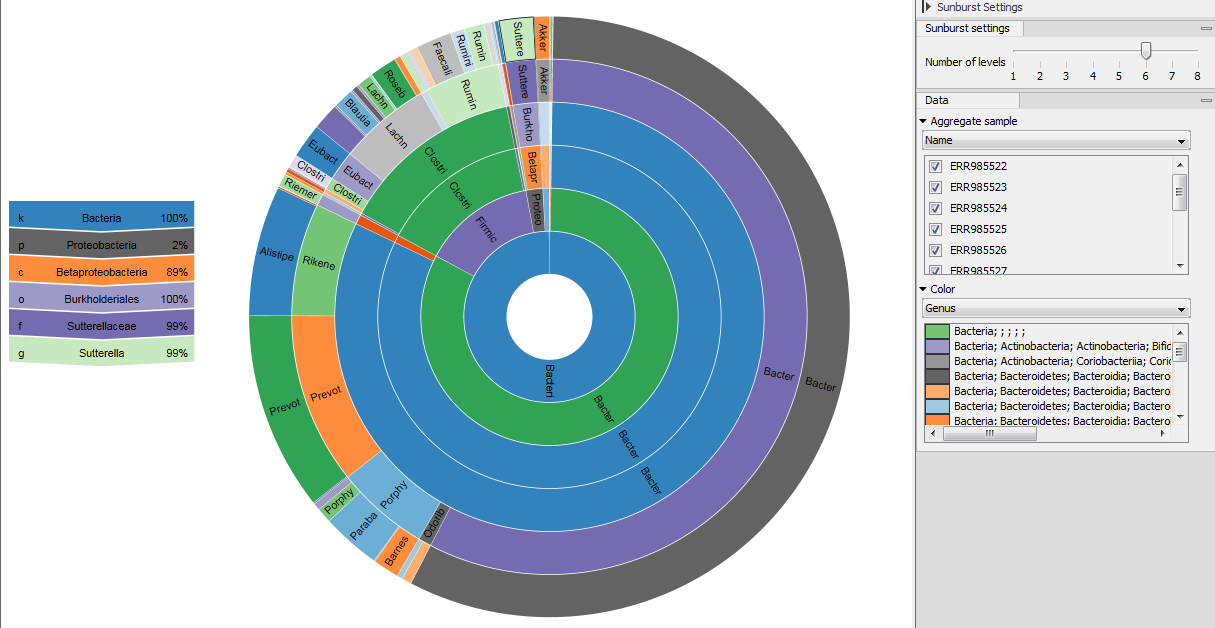
- Zoomable Sunbursts (
 )
The Zoomable Sunburst viewer lets the user select how many taxonomy level
counts to display, and which level to color. Lower levels will inherit the
color in alternating shadings. Taxonomy and relative abundances (the ratio
between the coverage of the species in a specific sample and the
total amount of coverage in the sample) are displayed in a legend to the left
of the plot when hovering over the sunburst viewer with the mouse. The metadata
can be used to select which sample or group of samples to show in the sunburst
(figure 5.7).
)
The Zoomable Sunburst viewer lets the user select how many taxonomy level
counts to display, and which level to color. Lower levels will inherit the
color in alternating shadings. Taxonomy and relative abundances (the ratio
between the coverage of the species in a specific sample and the
total amount of coverage in the sample) are displayed in a legend to the left
of the plot when hovering over the sunburst viewer with the mouse. The metadata
can be used to select which sample or group of samples to show in the sunburst
(figure 5.7).
Clicking on a lower level field will render that field the center of the plot and display lower level counts in a radial view. Clicking on the center field will render the level above the current view the center of the view.