Running an analysis directly from a Result Metadata Table
Analysis results from tools listed in the table of section 9.3 are automatically added to the Result Metadata Table as long as it was performed on samples associated with metadata. Content of the Result Metadata Table may be managed in similar ways as other tables in CLC Genomics Workbench (http://resources.qiagenbioinformatics.com/manuals/clcgenomicsworkbench/current/index.php?manual=Filtering_tables.html), but it can also be used to start new analyses using the With selected (![]() ) button which provides the option of various downstream analysis of the selected dataset.
) button which provides the option of various downstream analysis of the selected dataset.
To perform an analysis on one or more samples, begins by selecting the relevant rows followed by finding the associated elements by clicking on the Find Associated Data (![]() ) button. All associated elements are then listed in window below called Metadata Elements. You can see an example in figure 9.11, where a Metadata Result Table includes 6 rows (Metadata, top view), while 30 elements are found to be associated to these 6 rows (Metadata Elements, bottom view).
) button. All associated elements are then listed in window below called Metadata Elements. You can see an example in figure 9.11, where a Metadata Result Table includes 6 rows (Metadata, top view), while 30 elements are found to be associated to these 6 rows (Metadata Elements, bottom view).
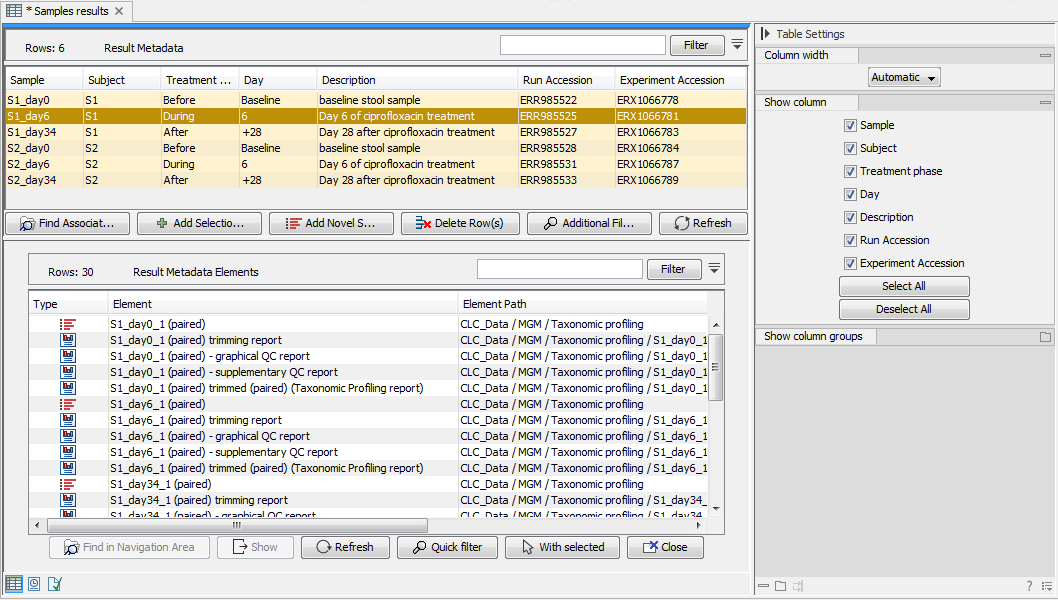
Figure 9.11: In total, 30 files are associated to the selected 6 sample rows within the Result Metadata Table.
As the number of samples, metadata and data elements increases over time, and the Result Metadata Table likely will include a mix of analyzed and novel samples, it is helpful to perform filtering steps to identify the elements you are looking for (see section 9.4.1). Once filtering is done, it is easy to select the remaining rows of data elements and click the With selected (![]() ) button to start tools such as Create K-mer Tree and Create SNP Tree, or initiate a workflow analyses using an opened and customized version of a workflow.
) button to start tools such as Create K-mer Tree and Create SNP Tree, or initiate a workflow analyses using an opened and customized version of a workflow.
Subsections