Selecting sequences for
scanning
To run the Evaluate Structure Hypothesis tool, go to:
Tools | RNA Structure (![]() )|
Evaluate Structure Hypothesis (
)|
Evaluate Structure Hypothesis (![]() )
)
This opens the dialog shown in figure 24.25.

Figure 24.25: Selecting RNA or DNA sequences for structure scanning.
If you have selected sequences before running the tool, those sequences will be listed in the Selected Elements pane of the dialog. Use the arrows to add or remove sequences or sequence lists from the selected elements.
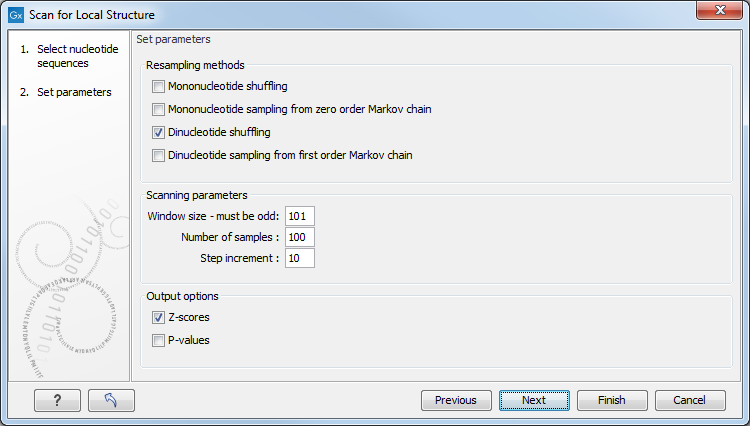
Click Next to adjust scanning parameters (see figure 24.26).

Figure 24.26: Adjusting parameters for structure scanning.
The first group of parameters pertain to the methods of sequence resampling. There are four ways of resampling, all described in detail in [Clote et al., 2005]:
- Mononucleotide shuffling. Shuffle method generating a sequence of the exact same mononucleotide frequency
- Dinucleotide shuffling. Shuffle method generating a sequence of the exact same dinucleotide frequency
- Mononucleotide sampling from zero order Markov chain. Resampling method generating a sequence of the same expected mononucleotide frequency.
- Dinucleotide sampling from first order Markov chain. Resampling method generating a sequence of the same expected dinucleotide frequency.
The second group of parameters pertain to the scanning settings and include:
- Window size. The width of the sliding window.
- Number of samples. The number of times the sequence is resampled to produce the background distribution.
- Step increment. Step increment when plotting sequence positions against scoring values.
The third parameter group contains the output options:
- Z-scores. Create a plot of Z-scores as a function of sequence position.
- P-values. Create a plot of the statistical significance of the structure signal as a function of sequence position.
