Hierarchical clustering of features
A hierarchical clustering of features is a tree presentation of the similarity in expression profiles of the features over a set of samples (or groups).
The tree structure is generated by
- letting each feature be a cluster
- calculating pairwise distances between all clusters
- joining the two closest clusters into one new cluster
- iterating 2-3 until there is only one cluster left (which will contain all samples).
To start the clustering of features:
Tools | Expression Analysis (![]() )| Feature Clustering (
)| Feature Clustering (![]() ) | Hierarchical Clustering of Features (
) | Hierarchical Clustering of Features (![]() )
)
Select at least two samples ( (![]() ) or (
) or (![]() )) or an experiment (
)) or an experiment (![]() ).
).
Note! If your data contains many features, the clustering will take very long time and could make your computer unresponsive. It is recommended to perform this analysis on a subset of the data (which also makes it easier to make sense of the clustering. Typically, you will want to filter away the features that are thought to represent only noise, e.g. those with mostly low values, or with little difference between the samples). See how to create a sub-experiment in Creating sub-experiment from selection.
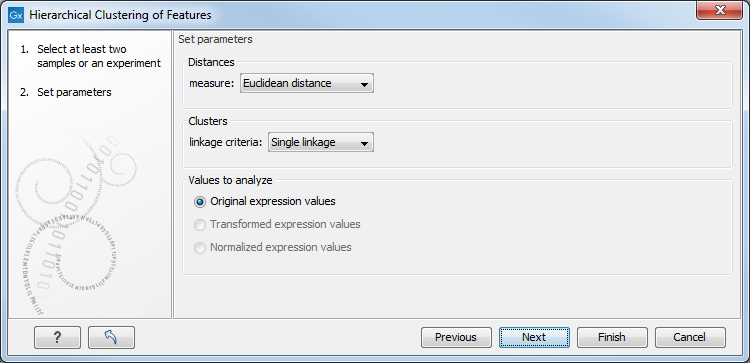
Clicking Next will display a dialog as shown in figure 25.39. The hierarchical clustering algorithm requires that you specify a distance measure and a cluster linkage. The distance measure is used specify how distances between two features should be calculated. The cluster linkage specifies how you want the distance between two clusters, each consisting of a number of features, to be calculated.

Figure 25.39: Parameters for hierarchical clustering of features.
There are three kinds of distance measures:
- Euclidean distance. The length of the segment connecting two points. If
 and
and
 , then the Euclidean distance between
  and
and  is
is

- Manhattan distance. The distance between two points measured along axes at right angles. If
 and
and
 , then the Manhattan distance between
  and
and  is
is

- 1 - Pearson correlation. The Pearson correlation coefficient between
 and
and
 is defined as
where
 and
and  are the average and sample standard deviation, respectively, of the values in
  values.
The Pearson correlation coefficient ranges from -1 to 1, with high absolute values indicating strong correlation, and values near 0 suggesting little to no relationship between the elements.
Using 1 - | Pearson correlation | as the distance measure ensures that highly correlated elements have a shorter distance, while elements with low correlation are farther apart.
The distance between two clusters is determined using one of the following linkage types:
- Single linkage. The distance between the two closest elements in the two clusters.
- Average linkage. The average distance between elements in the first cluster and elements in the second cluster.
- Complete linkage. The distance between the two farthest elements in the two clusters.
At the bottom, you can select which values to cluster (see Selecting transformed and normalized values for analysis).
Click Finish to start the tool.
Subsections
