Looking for neighbors
An example of a read duplication can be easily distinguished when mapping reads to a reference sequence as shown in figure 8.1.
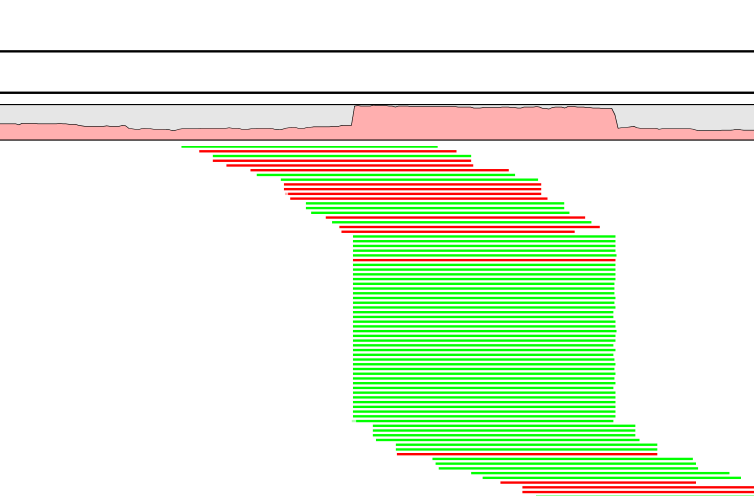
Figure 8.22: Mapped reads with a set of duplicate reads, the colors denote the strand (green is forward and red is reverse).
The typical signature is a lot of reads starting at the same position, resulting in a sudden rise in coverage, and all reads have the same orientation (denoted by the color). In a normal data set, you will also see fluctuations in coverage as shown in figure 8.2, but they lack the two important features of duplicate reads: they do not all start at exactly the same position, and they are from different strands.
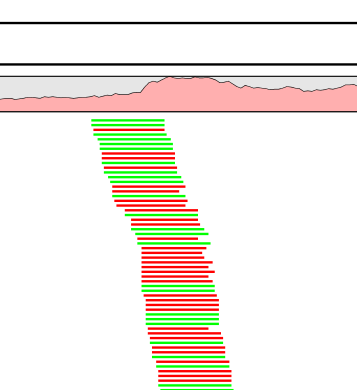
Figure 8.23: Rise in coverage.
The duplicate reads tool works directly on the sequencing reads, so there is no need to map the data to a reference genome first (figures 8.2 and 8.2 show the reads mapped for illustration purposes). In short, the algorithm will look for "neighboring" reads (i.e. reads that share most of the read sequence but with a small offset) and use these to determine whether there is generally high coverage for this sequence. If this is not the case, the read in question will be marked as a duplicate.
For certain sequencing platforms such as 454, the reads will have varying lengths - and this is taken into account by the algorithm as well.
SOLiD data is also supported, taking into account the dual base coding features of SOLiD data (color space).