Cross-view selections
There are a number of different ways of looking at an experiment as shown in figure 28.50).

Figure 28.50: An experiment can be viewed in several ways.
Beside the Experiment table (![]() ) which is the default view, the views are: Scatter plot (
) which is the default view, the views are: Scatter plot (![]() ), Volcano plot (
), Volcano plot (![]() ) and the Heat map (
) and the Heat map (![]() ). By pressing and holding the Ctrl (
). By pressing and holding the Ctrl (![]() on Mac) button while you click one of the view buttons in figure 28.50, you can make a split view. This will make it possible to see e.g. the experiment table in one view and the volcano plot in another view.
on Mac) button while you click one of the view buttons in figure 28.50, you can make a split view. This will make it possible to see e.g. the experiment table in one view and the volcano plot in another view.
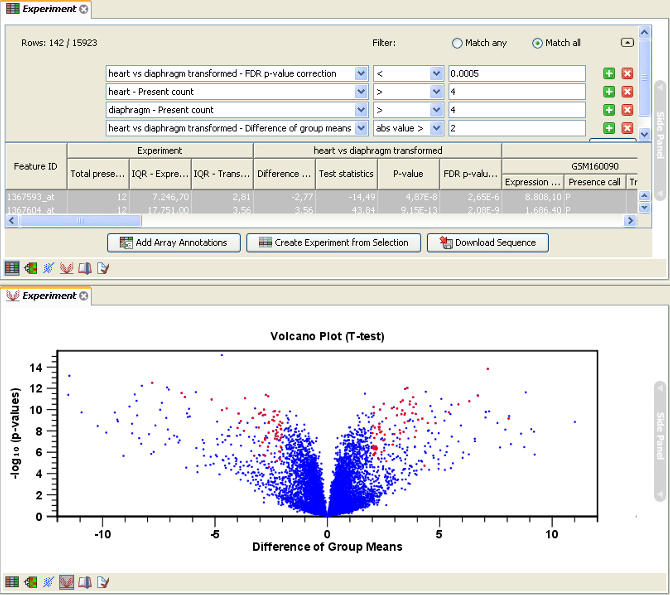
An example of such a split view is shown in figure 28.51.

Figure 28.51: A split view showing an experiment table at the top and a volcano plot at the bottom (note that you need to perform statistical analysis to show a volcano plot, see Statistical analysis).
Selections are shared between all these different views of an experiment. This means that if you select a number of rows in the table, the corresponding dots in the scatter plot, volcano plot or heatmap will also be selected. The selection can be made in any view, also the heat map, and all other open views will reflect the selection.
A common use of the split views is where you have an experiment and have performed a statistical analysis. You filter the experiment to identify all genes that have an FDR corrected p-value below 0.05 and a fold change for the test above say, 2. You can select all the rows in the experiment table satisfying these filters by holding down the Cntrl button and clicking 'a'. If you have a split view of the experiment and the volcano plot all points in the volcano plot corresponding to the selected features will be red. Note that the volcano plot allows two sets of values in the columns under the test you are considering to be displayed on the x-axis: the 'Fold change's and the 'Difference's. You control which to plot in the side panel. If you have filtered on 'Fold change' you will typically want to choose 'Fold change' in the side panel. If you have filtered on 'Difference' (e.g. because your original data is on the log scale, see the note on fold change in 28.3.2) you typically want to choose 'Difference'.
