Sample analysis details panel
When an analysis is selected in the Analyses table, information about it is displayed in the Sample analysis details panel to the right. This includes basic information such as the sample ID, the name of the analysis workflow, and log entries (figure 2.6), as well as more detailed information, described below.
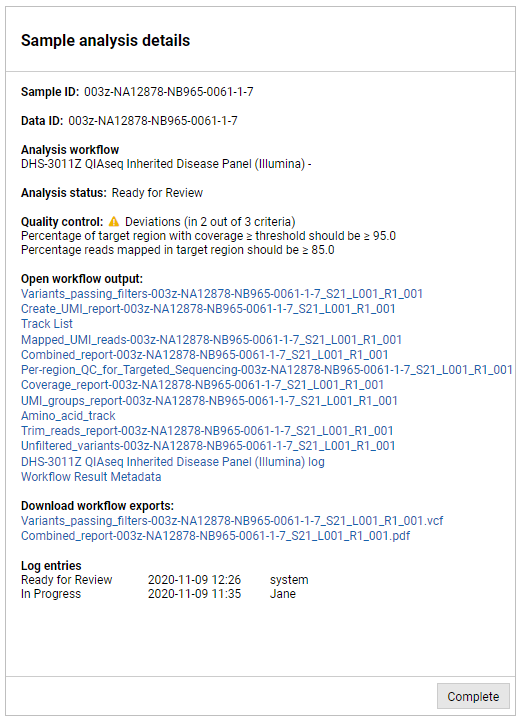
Figure 6: The Sample analysis details panel lists information relating to a selected analysis.
Quality control
The Quality control section reports on the criteria and thresholds configured for the analysis workflow. A green icon ( ) signals that all QC criteria passed. A yellow icon (
 ) flags a potential quality control issue. The text underneath lists the deviating criteria. The icon shown aligns with that presented in the Analyses table Status column.
Open workflow output
Under the Open workflow output heading are links to workflow outputs. Clicking on the links to these CLC format elements opens them in a CLC Genomics Workbench.
To open CLC format files by clicking on links, the following must be in place:
- The CLC Genomics Workbench is installed on the system you are working on, and it is a version compatible with the CLC Genomics Server that the Genomics Analysis Portal is running on. Information about compatible software versions is provided on the latest improvements information for the CLC Genomics Server:
https://digitalinsights.qiagen.com/products/qiagen-clc-genomics-server/latest-improvements/current-line/.
- The CLC Genomics Workbench is set as the default program for opening .clc files.
When you click a workflow output link, a dialog opens asking you to confirm you wish to open this file with the associated CLC Genomics Workbench (figure 2.7).
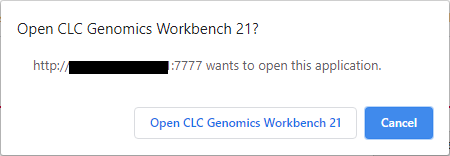
Figure 7: When you click on a workflow output link, you are asked to confirm that you wish to open the file using the relevant program for opening .clc files.
If not already running, the CLC Genomics Workbench will open and automatically log into the CLC Genomics Server sitting underneath the Genomics Analysis Portal.
Download workflow exports
If your workflow contains export elements, the Download workflow exports section will list the exported files. These are typically formats other than CLC, for example VCF, PDF, etc. If you click on an export link, the file will be saved to the location of your choice.