Analyses table
Analyses submitted from the Genomics Analysis Portal are listed in the Analyses table, which makes up the main part of the view area. Information in this table includes the sample ID, the analysis workflow used, the status of the analysis, and the time the analysis started.
Sorting the Analyses table
By default, the Analyses table is sorted according to the Analysis start time, with the item with the most recent time stamp at the top of the table.
You can sort according to other column values by clicking on the relevant column header. If you sort based on "Status", the sorting takes quality control status into account, placing analyses with quality control deviations at the top.
Click on a column heading twice to reverse the order. The table can be sorted based on values in multiple columns by holding down the Shift key while clicking on the relevant column headers.
Filtering for particular analyses in the Analyses table
The Analyses table can be filtered using the fields just below the table headers. The number of analyses listed after filtering is reported in the top, left side of the table. Clicking on the Clear all filters button at the top, right side of the table removes all the applied filters, so the full list of analyses is once again visible.
A particular analysis can be selected by clicking a table row. The Sample analysis details panel on the right will then show details about that analysis. Depending on the status of the analysis, different actions and information will be available. See Sample analysis details panel for further details.
Clicking the Enable multi-select button above the table introduces a multi-select column on the left hand-side of the Analyses table. When two or more analyses are selected, the Sample analysis details panel displays a list of the selected analyses and the available actions. If you select analyses with different states (figure 2.3), only actions common to the selected states will be available (figure 2.4).
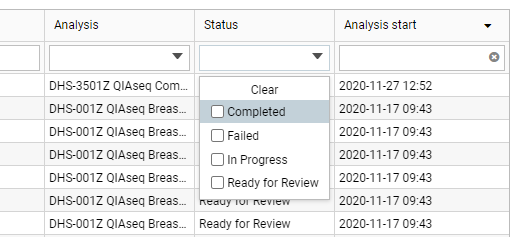
Figure 3: Analyses can be listed according to their state.
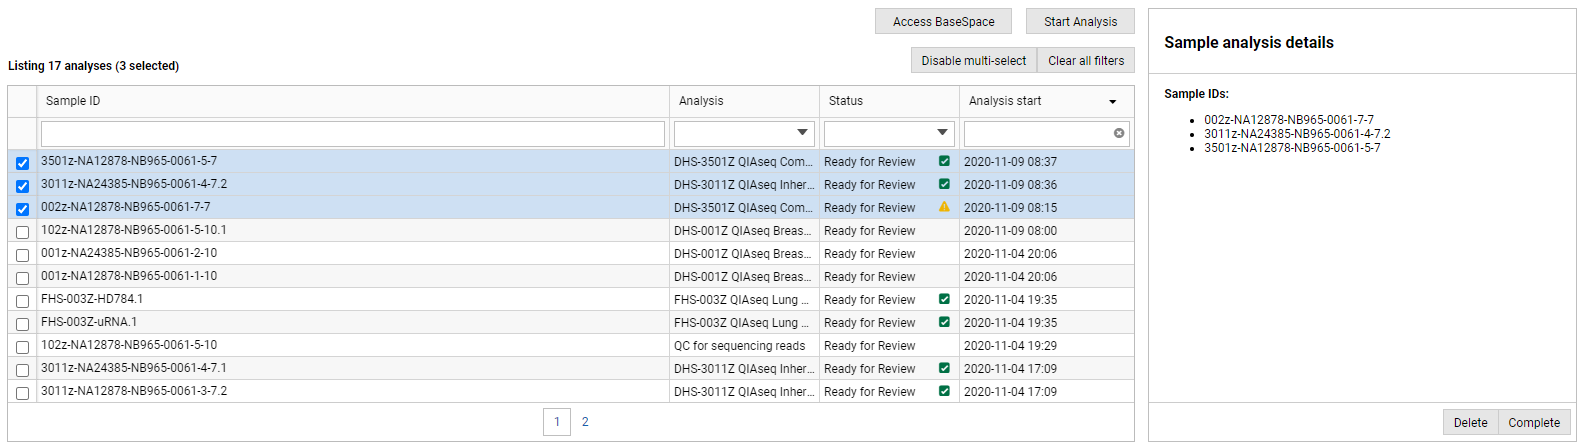
Figure 4: By enabling multi-select, you can select and apply the same action to multiple analyses at the same time.
Status of sample analyses
The Status column contains information about the analysis state, as described below. A quality control indicator is displayed for analysis workflows with quality control criteria configured (Sample analysis details panel), supporting the quick identification of analyses that pass or fail quality control checks.
- In Progress
For samples still being analyzed, the status field displays a progress bar (figure 2.5). The progress of queued samples remains at 1% until the analysis starts. When multiple samples are in the "In Progress" state, they are run sequentially, according to their order in the analysis queue.
You can stop an analysis by selecting the sample and clicking on Stop. This will remove the analysis from the list and discard any intermediate results.
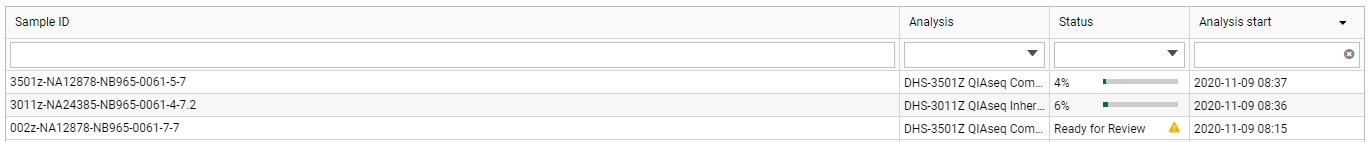
Figure 5: Two analyses are in the "In Progress" state, at 4% and 6% complete.- Ready for Review
- Analyses are set to Ready for Review when the analysis results are available. In this state results can be opened or downloaded via links in the Sample analysis details panel.
Users included in the CLC Genomics Server admin group will also see a Delete button. Clicking on this removes the analysis from the list and deletes results from the CLC Genomics Server.
- Completed
- Clicking on the Complete button moves an analysis into the Completed state. This can be used as an indication that results have been reviewed.
If archiving has been set up (Sample analysis details panel), completed analyses will be archived according to the archiving configuration. Archived analyses are not listed in the Analyses table.
Users included in the CLC Genomics Server admin group are able to Delete completed analyses. This removes analyses from the list and deletes results from the CLC Genomics Server.
- Failed
- An analysis failure is most often caused by technical issues, but can also be due to invalid or corrupt fastq files. It is not related to the quality of the sequencing data or the analysis results. To learn more about the cause of failure, select the sample analysis in the list and inspect the failure message displayed in the Sample analysis details panel.
To restart a failed sample, that is, to run the analysis again using the same input data and workflow, click on the Rerun button available at the bottom of the Sample analysis details panel.