tSNE for Single Cell
t-Distributed Stochastic Neighbor Embedding, tSNE, is a general purpose algorithm for visualizing high dimensional data in 2D or 3D [Maaten and Hinton, 2008]. In the CLC Single Cell Analysis Module, it is one of two ways of constructing a Dimensionality Reduction Plot (The tSNE for Single Cell tool can be found in the Toolbox here:
Dimensionality Reduction (![]() ) | tSNE for Single Cell (
) | tSNE for Single Cell (![]() )
)
The tool takes an Expression Matrix (![]() ) / (
) / (![]() ), or a Peak Count Matrix (
), or a Peak Count Matrix (![]() ), or both types of matrix as input. Note that when both types of matrices are provided, only cells that are in common to both matrices are used.
), or both types of matrix as input. Note that when both types of matrices are provided, only cells that are in common to both matrices are used.
tSNE for Single Cell offers options to run dimensionality reduction or feature selection prior to the tSNE algorithm. For details on these options, please see Feature selection and dimensionality reduction. The following additional options are available:
- Produce 3D plot. Perform a second tSNE calculation in three dimensions. As this involves a full re-calculation of tSNE in a higher dimension, the runtime is approximately doubled when this option is selected.
- Random seed. The algorithm contains a random component determined by the seed. This means that each value of the seed leads to a slightly different visualization.
- Iterations. The algorithm works by repeating the same steps a predefined number of times. There is, unfortunately, no good rule for determining how many iterations are appropriate. More iterations do no harm, but too few iterations may lead to clusters of cells failing to separate. Doubling the number of iterations approximately doubles the runtime.
- Automatically select perplexity. automatically chooses a value for the perplexity based on the number of cells,
 . This is set to
  for
for  (the highest value allowed by the data),
  for
for
 (a commonly used value in the literature),
  from
from
 (suggested by [Kobak and Berens, 2019]), and
  for
for
 .
.
- Perplexity. The perplexity roughly corresponds to the number of close neighbors (in expression space) that each cell has. Generally speaking, smaller values of the complexity lead to a tendency to form more clusters.
An example output is shown in figure 13.5. When interpreting tSNE plots, it is important to be aware that the tightness of clusters and distances between them may not reflect the actual intra- and inter-cluster similarities. Some examples of this are provided by [Wattenberg et al., 2016].
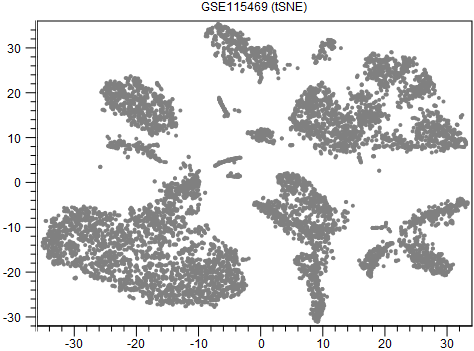
Figure 13.5: A tSNE visualization of data from [MacParland et al., 2018].
Implementation details
Barnes-Hut tSNE is implemented [Van Der Maaten, 2014]. If dimensionality reduction has been selected, the initial guess at the optimal layout is seeded using PCA and/or LSI (plus a small amount of random variation), and otherwise is uniformly random in the range 0 - 0.0001. The use of dimensionality reduction is recommended, because several authors have reported improved conservation of global structure in tSNE visualizations when PCA initialization is used.tSNE has several hyperparameters, which are set as follows:
- Early exaggeration factor:
-

- Learning rate:
-
 where is the number of cells
- Iterations for early exaggeration:
- 250
- Momentum during early exaggeration:
- 0.5
- Momentum for subsequent iterations:
- 0.8