Cluster Single Cell Data
Cluster Single Cell Data uses a graph-based clustering to automatically cluster cells. Typically the aim is to recover clusters that describe cells of different types or with different behavior.
The tool takes an Expression Matrix (![]() ) / (
) / (![]() ), or a Peak Count Matrix (
), or a Peak Count Matrix (![]() ), or both types of matrix as input, and produces a Cell Clusters (
), or both types of matrix as input, and produces a Cell Clusters (![]() ) result. Note that when both types of matrices are provided, only cells that are in common to both matrices are used.
) result. Note that when both types of matrices are provided, only cells that are in common to both matrices are used.
It can be found in the Toolbox here:
Cell Annotation (![]() ) | Cluster Single Cell Data (
) | Cluster Single Cell Data (![]() )
)
The tool offers options to run dimensionality reduction or feature selection prior to clustering. For details on these options, please see Feature selection and dimensionality reduction. The following additional options are available:
- Distance measure. The algorithm starts from a k-nearest neighbor graph, and the distance measure is used to find the `nearest' neighbors. The `1-Pearson correlation' distance is less sensitive to changes in the scale of expression between cells than Euclidean distance (for example, if one cell has exactly twice the expression of another for each gene, the `1 - Pearson correlation' distance is 0 while the Euclidean distance may be very large) and may be better at finding more distant neighbors. Conversely, Euclidean distance may provide higher resolution for distinguishing similar cell types.
- Neighborhood size. The number of cells `k' used in the k-nearest neighbor graph. This determines the granularity of the visualization. Smaller values may be better at recovering small clusters, but may also lead to larger clusters becoming fragmented.
- Use fixed resolution The resolution controls the coarseness of the clustering, with smaller values of the resolution leading to fewer clusters. When this option is disabled, results for several different resolutions from 0.1 to 1.5 are returned. Only when none of these resolutions appear appropriate would a fixed resolution typically be required.
- Resolution The fixed resolution to use.
The result of clustering is a Cell Clusters (![]() ) element containing clusters at different resolutions. It is easiest to view these in a Dimensionality Reduction Plot (
) element containing clusters at different resolutions. It is easiest to view these in a Dimensionality Reduction Plot (![]() ).
).
Generally speaking, a good clustering will have distinct clusters for each large clump of cells that appears to form a cluster by eye in the Dimensionality Reduction Plot. If this is not the case, the resolution may be too low (as in figure 12.1, compared with figure 12.2). Unfortunately, it can be hard to tell when the resolution is too high, but generally one or more of the clusterings at a default resolution will be suitable for downstream analysis.
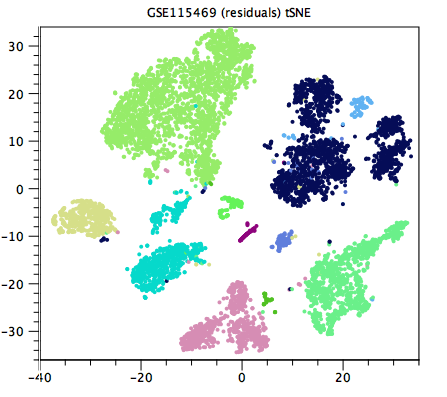
Figure 12.1: Clustering with too low resolution. Clusters that are distinct by eye are given the same color. Examples include the three dark blue clusters at the top-right corner of the plot, and the two turquoise clusters at x=-20. Data is from [MacParland et al., 2018].
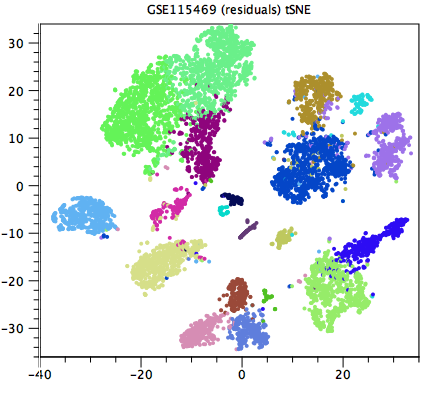
Figure 12.2: A higher resolution clustering of the same data as in figure 12.1. Each cluster that seems distinct by eye is now given its own color. The resolution is no longer too low. It can be difficult to determine whether the resolution is too high.
As the aim of clustering is usually to have clusters that correspond to different cell types, it is possible, from the Dimensionality Reduction Plot, to redraw the boundaries between clusters, to add new clusters, and to rename clusters. These changes might be based on insights from other sources of information such as:
- Predicted cell types from the Predict Cell Types tool.
- The expression of known marker genes for a cell type.
- Marker genes that have been detected from the clusters by Differential Expression for Single Cell.
Subsections