Interpreting the output of Create Heat Map for Cell Abundance
Figure 12.3 is an example of a plot showing how a third party tool's cell type annotations (columns) compare to the Leiden clusters with resolution=0.5 (rows) scaled using the "Per column" option. There seems to be a good concordance between the groups: there is mostly only one red rectangle per column.
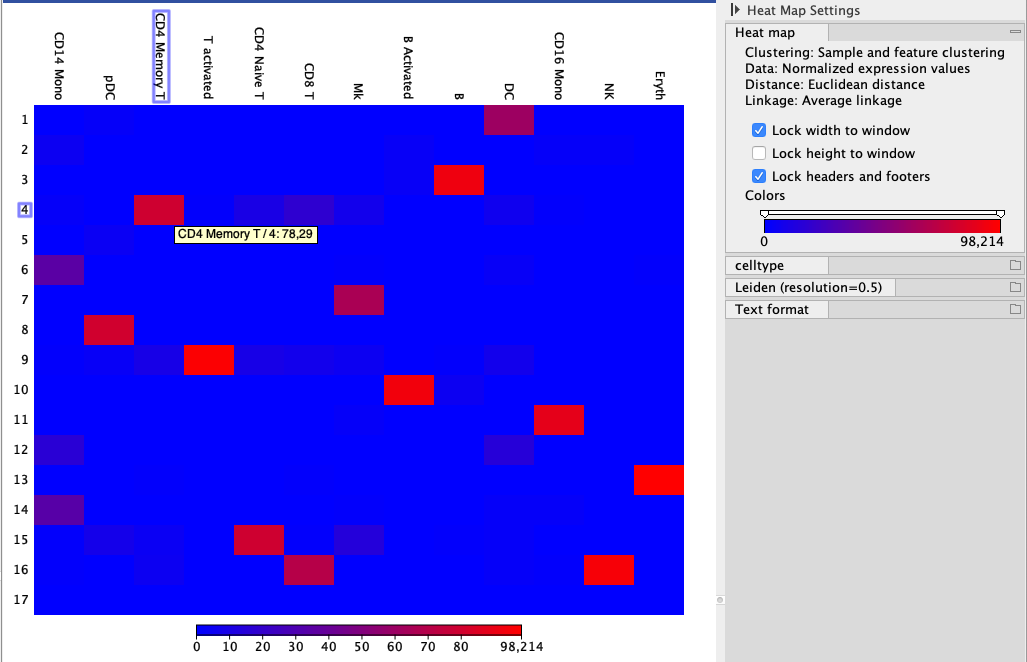
Figure 12.3: A heat map of cell type abundance showing Leiden clusters with resolution=0.5 calculated using the CLC Single Cell Analysis Module and compared to the cell types predicted by Seurat, using a tutorial data set (https://satijalab.org/seurat/archive/v3.2/immune_alignment.html). Hovering over the rectangle reveals the abundance of the selected combination, also indicated by the color.
Reordering the cell types can improve the visualization and make it easier to interpret the results (see figure 12.4). The red diagonal makes it clear that only minor differences exist between the two groupings.
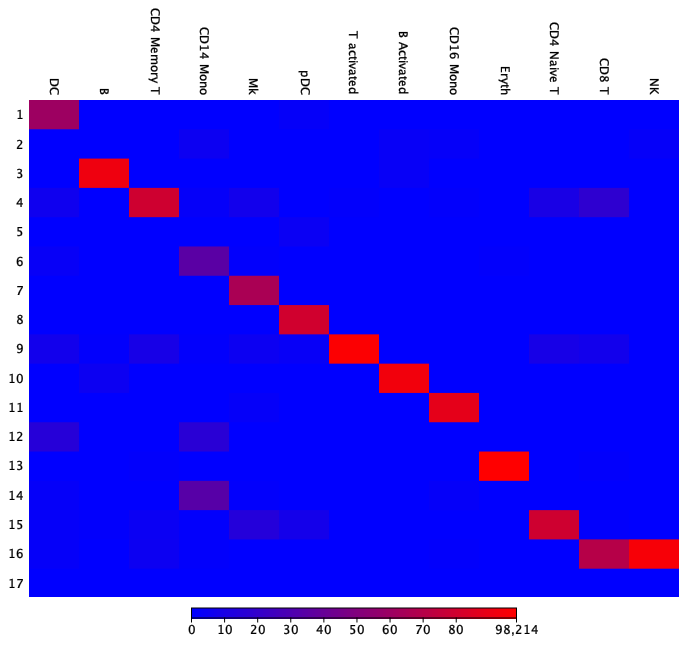
Figure 12.4: The heat map from figure 12.3 has been rearranged for easier interpretation by changing the order of the Seurat cell types.
Creating a new heat map using the "By all" scaling option shows whether most cells fall into the expected categories. Figure 12.5 illustrates how frequent each group combination is, with "15 - CD4 Naive T cells" and "6 - CD14 Mono cells" being most abundant.
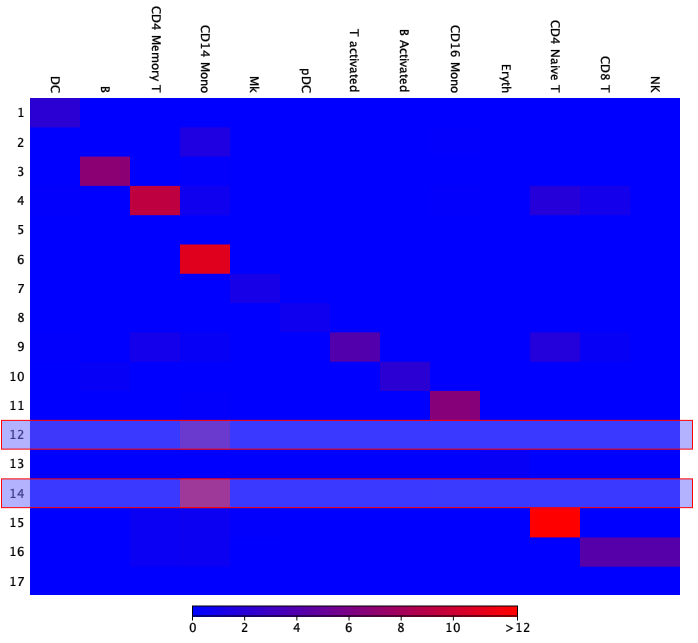
Figure 12.5: The heat map from figure 12.4 with all abundance entries summing up to 100. The highlighted clusters, 12 and 14, are annotated as CD14 Mono cells and have a relatively high abundance.
The heat maps of cell abundance indicate that "CD14 Mono cells" are split into four clusters, 2, 6, 12 and 14. These four clusters are adjacent in a UMAP plot (see figure 12.6), suggesting that they represent sub-types of "CD14 Mono cells".
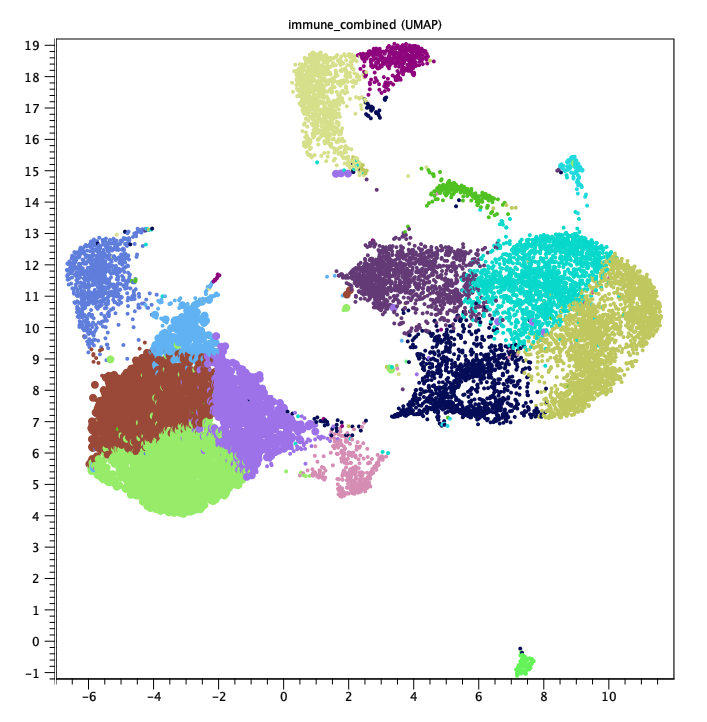
Figure 12.6: UMAP of the same data as in figure 12.5. The blue, green, lilac, and brown cells in the lower left corner correspond to clusters 2, 6, 12 and 14 respectively. Highlighted cells (larger points) are also "CD14 Mono cells".