Chromatin Accessibility and Expression Analysis from Matrix
The workflow Chromatin Accessibility and Expression Analysis from Matrix takes one or more pairs of an Expression Matrix (- a normalized Expression Matrix (
 ) / (
) / ( );
);
- a Dimensionality Reduction Plot (
 ) associated with the automated clusters, predicted cell types and additional cell annotations;
- a Heat Map (
 ), a Dot Plot (
 ), and a Violin Plot (
 ) with the predicted cell types as cell groups;
- a Cell Abundance Heat Map () with the automated clusters and predicted cell types as cell groups;
The workflow can be found in the Template Workflows section here:
Single Cell Workflows (![]() ) | From Reads (
) | From Reads (![]() ) | Chromatin Accessibility and Expression Analysis from Matrix (
) | Chromatin Accessibility and Expression Analysis from Matrix (![]() )
)
If you are connected to a CLC Server via your Workbench, you will be asked where you would like to run the analysis. We recommend that you run the analysis on a CLC Server when possible.
Note that sample in the input elements (Expression Matrix and Peak Count Matrix) must be the same for cells originating from the same sample. This can be achieved in different ways, depending on how the elements were generated:
- If the input elements were generated in the CLC Single Cell Analysis Module, the sample name can be set when running the Annotate Reads with Cell and UMI tool, see Setting the sample name.
- If the input elements were imported, the sample name in the Cell Clonotypes can be set to that from the Expression Matrix during import, see Import Cell Clonotypes.
- The tool Update to Common Sample Name (
 ) can be used for updating the sample name in either input element, see Update to Common Sample Name.
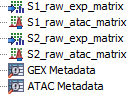
Figure 16.2: Two pairs of Expression Matrix and Peak Count Matrix with metadata for input
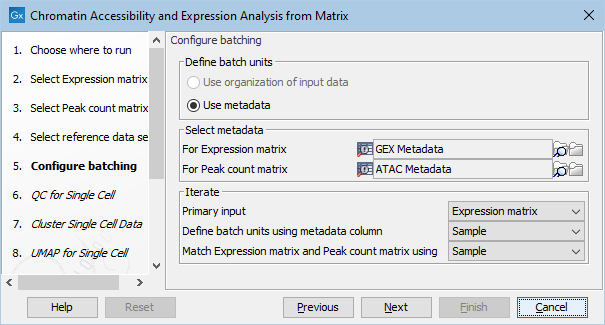
Figure 16.3: Configuring batching of two pairs of Expression Matrix and Peak Count Matrix
The inputs must be linked by metadata tables. That is, there must be one metadata table with all expression matrices and one with all peak matrices and the two must have a common column linking them (e.g., Sample). An example of input is in figure 16.2. The batching can be configured as shown in figure 16.3. In this example:
- The batching is based on the column "Sample" in the metadata table for the expression matrices. There will be one iteration per distinct value, which typically means per row.
- The expression and peak matrices are matched by the same "Sample" column. It must be present in both metadata tables. The matching column does not need to be the same as the batching column, but it typically is.
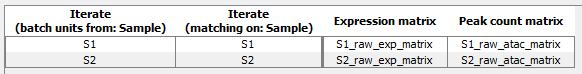
Figure 16.4: Batch overview for two pairs of Expression Matrix and Peak Count Matrix
There will be two iterations, one for the expression and peak matrix for sample S1 and one for S2 as shown in figure 16.4.
It is also possible to use the same metadata table for the expression and peak matrices. Then it must be selected twice in the batch configuration step.
Subsections