Output of restriction map analysis
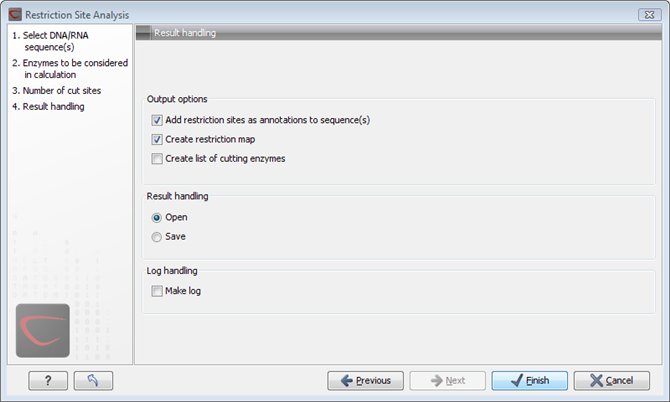
Clicking next shows the dialog in figure 20.43.

Figure 20.43: Choosing to add restriction sites as annotations or creating a restriction map.
This dialog lets you specify how the result of the restriction map analysis should be presented:
- Add restriction sites as annotations to sequence(s). This option makes it possible to see the restriction sites on the sequence (see figure 20.44) and save the annotations for later use.
- Create restriction map. The restriction map is a table of restriction sites as shown in figure 20.45. If more than one sequence were selected, the table will include the restriction sites of all the sequences. This makes it easy to compare the result of the restriction map analysis for two sequences (or more).
- Add restriction sites as annotations to sequence(s). This option makes it possible to see the restriction sites on the sequence (see figure 20.44) and save the annotations for later use.
- Create restriction map. When a restriction map is created, it can be shown in three different ways:
- As a table of restriction sites as shown in figure 20.45. If more than one sequence were selected, the table will include the restriction sites of all the sequences. This makes it easy to compare the result of the restriction map analysis for two sequences.
- As a table of fragments which shows the sequence fragments that would be the result of cutting the sequence with the selected enzymes (see figure20.46).
- As a virtual gel simulation which shows
the fragments as bands on a gel (see figure 20.48).
For more information about gel electrophoresis, see Gel electrophoresis.
In order to complete the analysis click Finish (see section 8.2 for information about the Save and Open options).
