Output from the Detect and Refine Fusion Genes tool
The Detect and Refine Fusion Genes tool produces a number of outputs:
- Fusion Genes (WT): The Fusion Genes track contains the breakpoints of all detected fusions. The track is described in more details below, see 33.4.2.
- Reads (WT): A read mapping to the WT genome. Reads are mapped to a combination of the WT genome and the artificial fusion chromosomes. Reads mapping better to the artificial fusion chromosomes will be in the Reads (fusions) output.
- Unaligned Ends: A read mapping showing where the unaligned ends map to the reference genome. The unaligned ends track is useful when choosing how to set the options "Minimum unaligned end read count", "Minimum length of unaligned sequence", and "Maximum distance to exon boundary" for a particular panel and sequencing protocol in order to find known fusions, as it shows which unaligned ends of reads were considered and where they were mapped. Note that the unaligned reads are mapped using RNA-Seq Analysis default options allowing a maximum of 10 hits per read.
- Fusion Genes (fusions): Breakpoints for the detected fusions on the artificial reference.
- Reads (fusions): A read mapping to the artificial fusion chromosomes. Reads are mapped to a combination of the WT genome and the artificial fusion chromosomes. Reads mapping better to WT genome will be in the Reads (WT) output.
- Reference Sequence (fusions): Reference sequence for the artificial reference.
- mRNA (fusions): mRNA transcripts corresponding to the detected fusions on the artificial reference.
- Genes (fusions): Gene region for the fused gene product on the artificial reference.
- CDS (fusions): If the CDS track was provided, this track contains the CDS region for the fused gene product on the artificial reference.
- Primers (fusions): If a primer track was provided, this track contains the primer regions on the artifical reference. Note that only primers for genes involved in a detected fusion will be represented here, and that the same primer can be in multiple fusion chromosomes, if the the same gene is involved in multiple fusions.
- Report: A report containing graphical representations of the fusions passing all filters. The report is described in more detail below, see 33.4.2.
Fusion tracks
The fusion track has a table view describing the fusions or exon skipping events on multiple lines, with two lines for each breakpoint that was detected. It contains the following information:
- Chromosome. Chromosome where "Gene" and "Transcript" are located.
- Region. Breakpoint position of the fusion event relative to the reference sequence hg38.
- Name. Short name of the fusion, 5' gene-3' gene.
- Fusion number. Rows the with same fusion number describe fusions between the same two genes.
- Fusion pair. For each fusion number, a unique number identifying the connection of two breakpoints.
- Gene. The fusion gene that corresponds to the "Chromosome" and "Region" fields.
- 5' or 3' gene. The fused 5' and 3' genes.
- Breakpoint type. 3' or 5'.
- Fusion crossing reads. Number of reads crossing the fusion breakpoint.
- 5' or 3' read coverage. Number of reads (unaligned ends and pairs) that cover the 5' or 3'-transcript breakpoint, including normal transcripts and fusion transcripts.
- Z-score. Converted from the P-value using the inverse distribution function for a standard Gaussian distribution.
- P-value. A measure of certainty of the call calculated using a binomial test, it is calculated as the probability that an observation indicating a fusion event occurs by chance when there is no fusion. The closer the value is to 0, the more certain the call. Although one should avoid strictly interpret the p-value as the true false positive rate, our test data show that the p-value seems to be appropriately calibrated using standard option settings.
- Filter. Contains information about checks that fail (e.g. high p-values, low Z-scores or few supporting reads), or "PASS" if all checks passed.
- Translocation name. Description of the fusion in the COSMIC format (http://cancer.sanger.ac.uk/cosmic/help/fusion/summary) using the preferred transcript.
- Compatible transcripts. All known transcripts with which the fusion reads are compatible. Transcripts are 'compatible' with fusion reads if they include the exon boundary at which the fusion occurs. If there are no known compatible transcripts then an artificial transcript will be listed with a name such as "10-gene27693-32015547-BEGINNING-0" This shows that the transcript was created for gene27693 on chromosome 10, by modifying the beginning of an existing exon, in order to describe a breakpoint at position 32015547 (the final "0" is just a counter).
- Exon skipping. Whether the fusion is a same-gene fusions where the 5' breakpoint is upstream of the 3' breakpoint.
- Fusion with novel exon boundaries. Indicates if one or both fusion breakpoints are at a novel exon boundary.
- Found in-frame CDS. This column is present when a CDS track was specified as input. It contains "Yes" if at least one fusion CDS that stays in frame across the fusion breakpoints has been found. Note that the in-frame calculation only takes into account the frame of the last included exon in the 5' gene and the first included exon in the 3' gene, and ignores more complex factors that might affect frame, such as frameshift mutations or stop codons due to variants around the fusion breakpoints.
- Breakpoint distance. The physical distance between the break points when on the same chromosome, otherwise -1.
- Original chromosome. Present only in tracks based on a fusion reference.
- Original breakpoint region. Present only in tracks based on a fusion reference.
- Fusion plot. Contains a link to a QIMERA fusion plot. Click on the link to open the plot.
Detect and Refine Fusion Genes report
In the Result handling dialog, it is possible to choose to output a report containing sample and unaligned ends information as well as detailed information and plots for all fusions passing filters (figure 33.53):
The report has three sections: "Summary", "Unaligned Ends" and "Fusions". The summary section has a table with the sample name. The unaligned ends section contains a table with statistics on the unaligned ends used to detect fusions, the table has the following information:
- Unaligned ends: number of found unaligned ends.
- Mapped unaligned ends: number of unaligned ends which could be mapped
- Unmapped unaligned ends: number of unaligned which could not be mapped.
- Discarded base breakpoints: when two transcripts of the same gene overlap so that two breakpoints are found next to each other, one of them will be discarded.
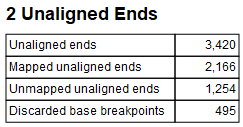
Figure 33.53: Unaligned ends section in Detect and Refine Fusion Genes report.
The Fusion section lists all fusions with FILTER=PASS. Each Fusion Gene is described by two tables and a fusion plot (figure 33.54).
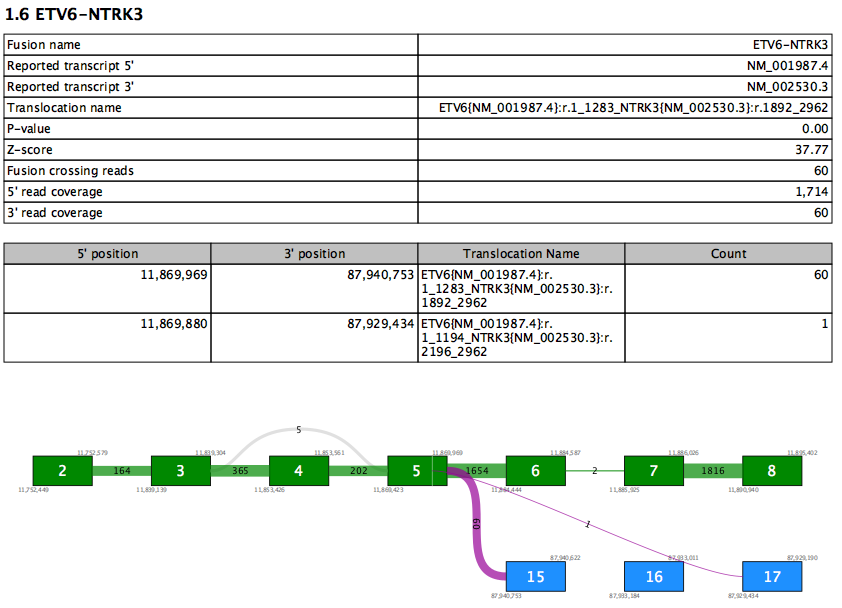
Figure 33.54: A report section for a fusion gene.
The first table contains an overview of the most supported fusion for the fusion gene. Values in this table include:
- Reported transcript 5'/3' - the reported transcript is the highest priority transcript that is compatible with this fusion
- Translocation name - HGVS description of the fusion against the reported transcripts
- Fusion crossing reads - the number of reads that splice from the 5' exon and into the 3' exon
- 5'/3' read coverage - the total number of reads that splice at the 5'/3' exon. This number is therefore always at least as high as fusion crossing reads.
The second table lists values for all supported fusion breakpoints in the fusion gene, sorted by read count. Therefore the first row in the table recapitulates some of the values from the first table. Additional rows show evidence for other fusions between the same two genes. At most 10 rows are shown.
The fusion plot visualizes all fusions between the reported transcripts.
- Green box - an exon in the 5' reported transcript
- Blue box - an exon in the 3' reported transcript
- Gray box - an exon that is not in the reported transcript. This may be present in other transcripts, or may represent a novel exon not seen in any transcript.
- Purple lines - fusion connections. The number of reads supporting the fusion is written on the line. Note that it is possible for a fusion present in the second table to be absent here if that fusion is between exons not present in the reported transcripts.
- Gray lines - connections due to alternative splicing between exons in the reported transcript. The number of reads splicing between the exons is shown on each line.
- White vertical lines within green or blue boxes - indicate that fusion reads spliced > 12nt into the exon rather than at the exon boundary
Known limitations
- The tool is not suitable for detection of circRNAs. Evidence of back-splicing is filtered out.
- Fusions that involve a mix of sense and antisense exons are filtered out.
- Fusions that involve more than two genes in the fusion product are not explicitly detected.
- Fusions will not be reported for a gene if they involve fusing into a region before the first annotated exon or after the last annotated exon of that gene.