De novo assembly output
In addition to the sequence list of assembled contigs, the following outputs are available:
- Create report. Creates a summary report.
- Create assembly graph. Generates a visual representation of the assembly showing the contigs and connections between them.
De novo assembly report
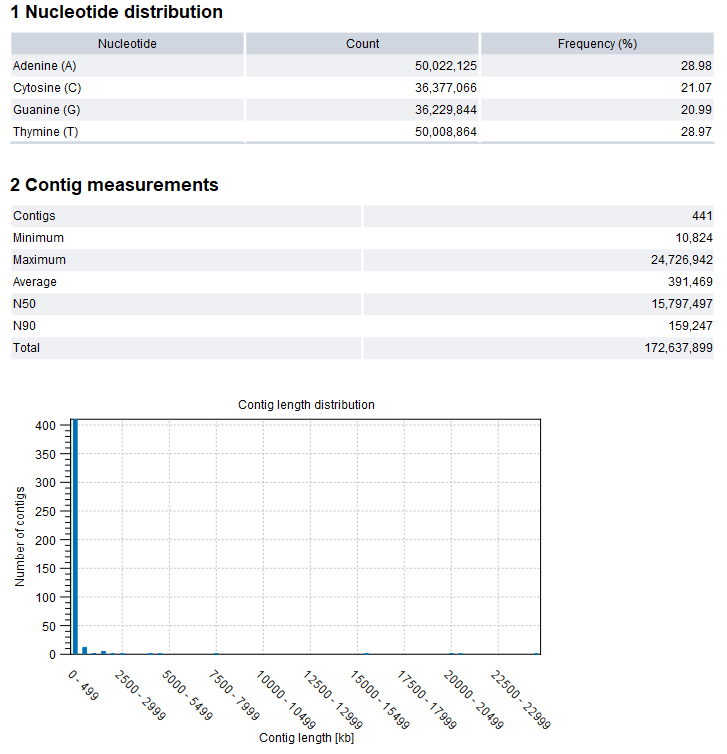
Figure 4.2: De Novo Assemble Long Reads report
The assembly report contains information on the base and length distributions of the contigs. An example of the first sections of the report is shown in figure 4.2.
- Nucleotide distribution.
- Contig measurements. Statistics about the number and lengths of contigs.
- Contigs. The number of contigs.
- Minimum, Maximum, Average. Minimum, maximum and average contig length.
- N50. The length of the shortest contig in sets of contigs of equal length or longer, where the summed length of contigs is at least 50% of the total contig length. As such, N50 is the shortest contig length that must be included to cover 50% of the assembly.
- N90. The length of the shortest contig in a set of contigs of equal length or longer, where the summed length of contigs is at least 90% of the total contig length. As such, N90 is the shortest contig length that must be included to cover 90% of the assembly. N90 will be equal to or smaller than N50.
- Total. The number of bases in the contigs. This can be used for comparison with the estimated genome size to evaluate how much of the genome sequence is included in the assembly.
- Contig length distribution. The number of contigs found at a specific length.
- Accumulated contig length. The y-axis shows the summed contig length, while the x-axis represents the number of contigs, arranged with the largest contigs first. This provides insight into the number of contigs required to cover, for instance, half of the genome.
- K-mer coverage.
- K-mer plot. Illustrates the frequency distribution of k-mers based on their occurrences. For homozygous samples, a single peak is expected around the read coverage. For heterozygous samples, two peaks should be visible, with the smaller peak corresponding to the heterozygous read coverage and the larger peak corresponding to the homozygous read coverage.
- Homozygous coverage peak. Estimated homozygous coverage.
- Heterozygous coverage peak. Estimated heterozygous coverage.
Assembly graph
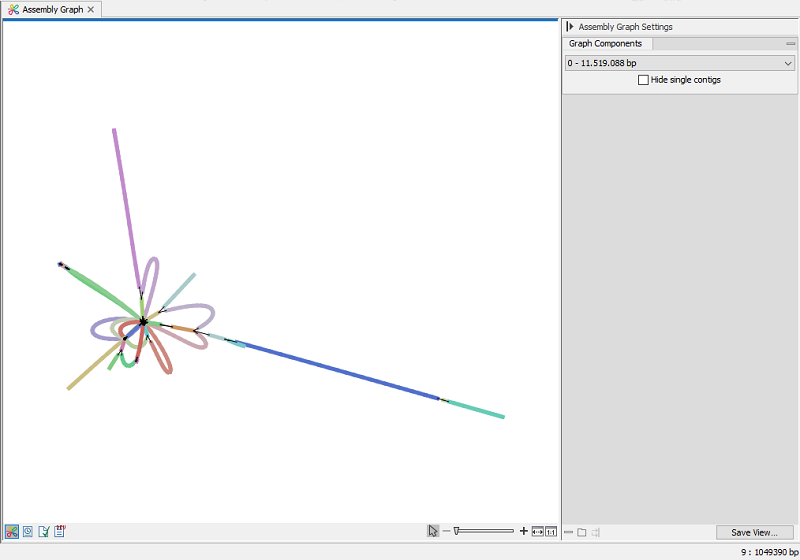
Figure 4.1: Assembly graph view
The assembly graph provides visual representations of the sequences in the contig list, and sequences that were excluded.
The viewer shows a single graph component (group of connected sequences) at a time. You switch between them using the Side Panel Graph components dropdown. To exclude graphs composed of a single contig, select Hide single contigs.
Hover your mouse over the colored line of a contig to see the name and length of the contig at the lower right corner of the view.
Dragging a contig initiates a layout animation. The animation aims to adhere to a graph layout governed by a set of force-directed rules. Consequently, when a contig is moved in a specific direction, the algorithm will strives to return to a low-energy state.