Create Peak Graph Track
Create Peak Graph Track uses a Read Mapping (
Tools | Single Cell Analysis (![]() ) | Chromatin Accessibility (
) | Chromatin Accessibility (![]() ) | Create Peak Graph Track (
) | Create Peak Graph Track (![]() )
)
It is recommended to only use read mappings produced by Single Cell ATAC-Seq Analysis, as otherwise the presence of duplicate reads can make peaks less clear.
The Scaling option impacts the height of the graph track, and is useful for comparing peaks from different tracks without changing the relative height of peaks within the same track:
- None. The height corresponds to the number of fragments sequenced at each position.
If one track has 5 times more reads in a peak than the other, then the height of the peak will be 5 times greater.
This allows the signal strength for each peak for a group of cells to be seen.
- By number of cells. The height is scaled by the number of cells in a group.
If one track has 5 times more reads in a peak than the other, but also 5 times more cells in the group, then the heights of the peaks will be the same.
This allows the shapes of peaks from large and small groups of cells to be compared.
Only paired end reads are used to create the graph, and broken pairs are discarded. Fragments are corrected to the cut site by offsetting read start sites by +4nt for forward reads and -5nt for reverse reads.
The peak graph track often provides a more intuitive visualization of peaks than a Read Mapping and uses much less diskspace. The visualization is more intuitive because the unsequenced part of each fragment that lies between the two reads of a pair is counted towards the coverage of the peak graph, but does not count towards the coverage of the Read Mapping.
To visualize the effect of scaling in a Track List, all graph tracks must be shown on the same scale. To do this, check the Fix graph bounds option in the Side Panel.
Figures 12.4-12.6 illustrate the effect of different settings on a single sample from [Taavitsainen et al., 2021]. The read mapping for three groups is obtained using Split by Cell, and a peak graph track is created for each group.

Figure 12.4: A Track List showing the Read Mapping coverage graph (top), called peaks, and peak graph tracks for three groups of cells of very different sizes. Fix graph bounds is not checked in the Side Panel, so each graph track is independently rescaled to use the available space. This means that the graph tracks for each group appear the same regardless of whether they have no scaling or are scaled by number of cells.

Figure 12.5: The same Track List as in figure 12.4, but only showing the graph tracks without scaling and with Fix graph bounds checked in the Side Panel. There are many more cells in group 3 than in group 1, and this is reflected by the heights of the graphs - the signal at each of the two peaks is much stronger in group 3 than in group 1.
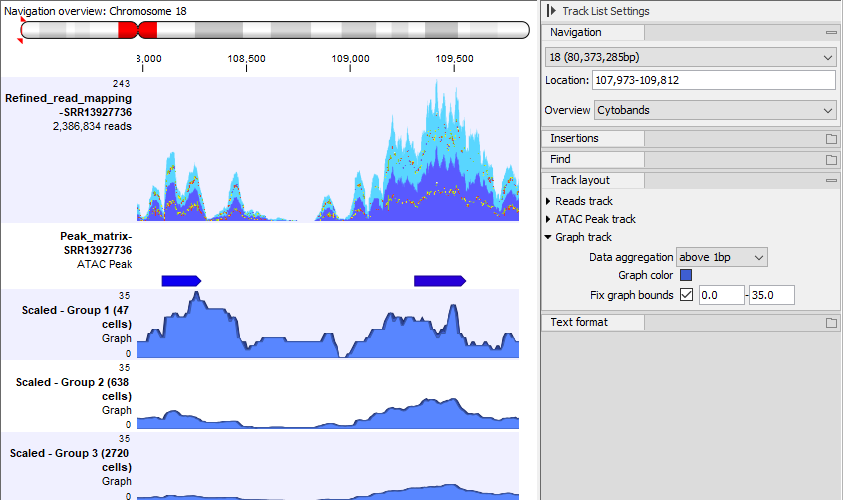
Figure 12.6: The same Track List as in figure 12.4, but only showing the graph tracks with scaling by number of cells and with Fix graph bounds checked in the Side Panel. The heights of the graphs are much greater in group 1 than in group 3. This is because a greater fraction of the cells in group 1 than in group 3 have reads in the peaks.