When is batch correction appropriate?
When in doubt if batch correction is appropriate:
- Run Normalize Single Cell Data using "None".
- Evaluate the results by looking at how well cells from different samples are mixed within clusters in a Dimensionality Reduction Plot, as exemplified below.
Consider figures 7.24 and 7.25, where cells are colored by sample. Without batch correction (plots to the left), the cells visually cluster by sample, while with batch correction (plots to the right), the samples are mixed. Batch correction is:
- Inappropriate in figure 7.24, because each sample consists of a single cell type. The effect of batch on expression is confounded with the effect of cell type on expression, making it impossible to remove one without also removing the other.
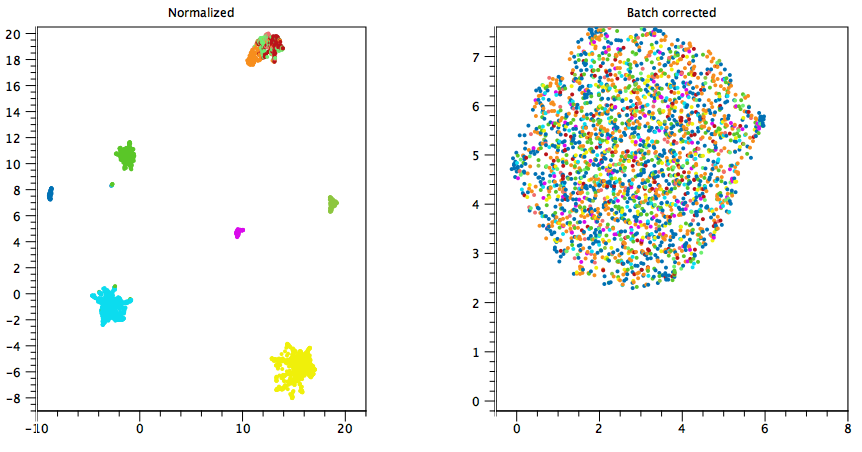
Figure 7.24: Batch correction is undesirable. Each color represents a sample, containing a single cell type. Left: UMAP plot of normalized data without batch correction. The cells cluster by sample, i.e. cell type. Right: UMAP plot of batch corrected data, using "Each sample is a batch". A single cluster is observed, as batch correction also removed differences due to cell type. - Appropriate in figure 7.25 if the samples have been subjected to the same experimental conditions, as we would suspect a batch effect was present.
- Inappropriate in figure 7.25 if the samples have been subjected to different experimental conditions. The effect of batch on expression is confounded with the effect of experimental condition, making it impossible to remove one without also removing the other.
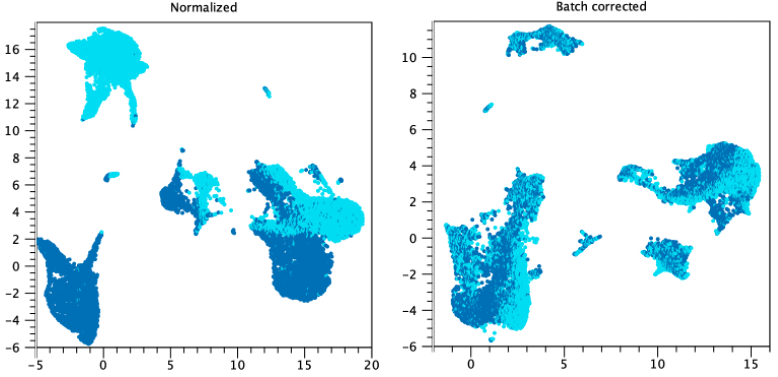
Figure 7.25: Batch correction may be desired. Each color represents a sample. Left: UMAP plot of normalized data without batch correction. Several clusters can be seen for each of two samples. Right: UMAP plot of batch corrected data, using "Each sample is a batch". Clusters contain a mixture of both samples. Data is from the Seurat tutorial.