Differential Abundance Analysis
This tool performs a generalized linear model differential abundance test on samples, or groups of samples defined by metadata.
To run the tool:
Toolbox | Microbial Genomics Module (![]() ) | OTU clustering (
) | OTU clustering (![]() ) | Differential Abundance Analysis (
) | Differential Abundance Analysis (![]() )
)
In the wizard dialog (figure 5.1), you can specify an abundance table such as the ones produced by the OTU Clustering tool or the Merge Abundance Tables tool. You can also specify if you want to test differential abundance based on metadata defined groups of samples, or if you want to correct the results based on a metadata defined group of samples. Finally you can choose whether you want the comparison to be done across groups or between all group pairs.
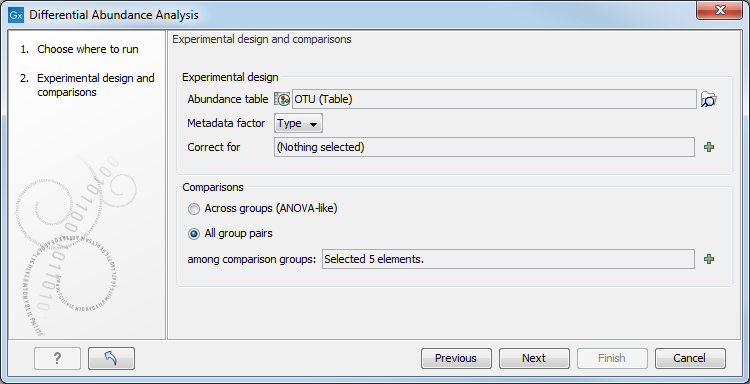
Figure 5.1:
Specify an abundance table and other parameters.
The tool generates a Venn diagram for three pairwise comparisons at a time (figure 5.2). You can select which comparisons should be shown using the drop down menus in the side panel. Clicking a circle segment in the Venn diagram will select the samples of this segment in the differential abundance analysis table view. The table summarizes abundances, fold changes, differential abundance p-values, multi-sample corrected p-values, etc.
The values included in the table for each pairwise comparison are:
- Max group means For each group in the statistical comparison, the average RPKM is calculated. This value is the maximum of the average RPKM's.
- -log2 fold change The logarithmic fold change.
- Fold change The (signed) fold change. Genes/transcripts that are not observed in any sample have undefined fold changes and are reported as NaN (not a number).
- P-value Standard p-value. Genes/transcripts that are not observed in any sample have undefined p-values and are reported as NaN (not a number).
- FDR p-value The false discovery rate corrected p-value.
- Bonferroni The Bonferroni corrected p-value.
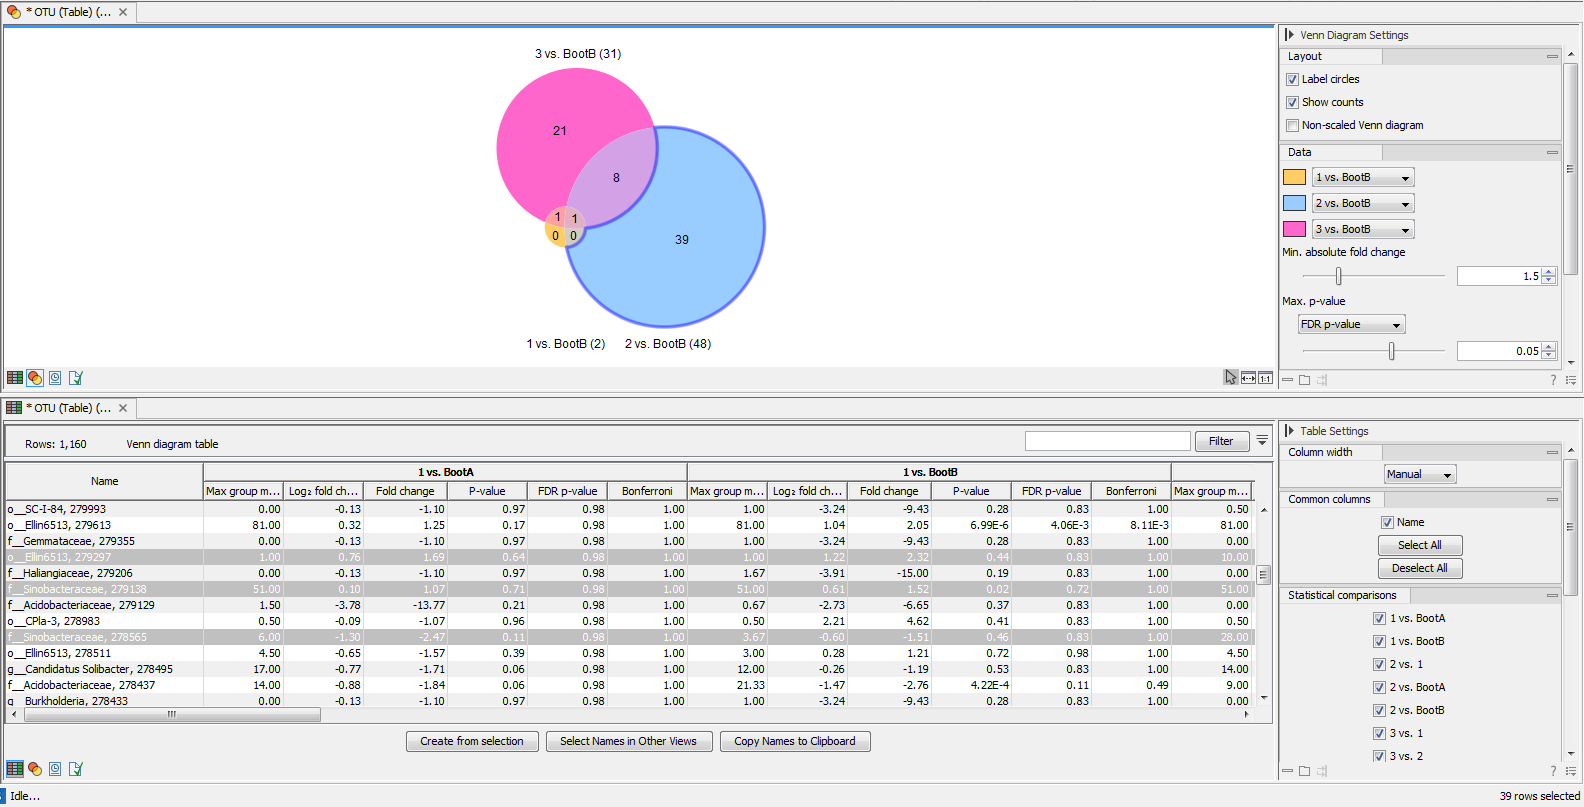
Figure 5.2:
Venn diagram for three comparisons at a time. Selecting a segment will highlight the samples in the differential abundance table opened below in split view.
It is possible to create a subset list of samples using the Create from selection button. As usual, the table can be adjusted with the right hand side panel options: it is possible to adjust the column layout, and select which columns should be included in the table.