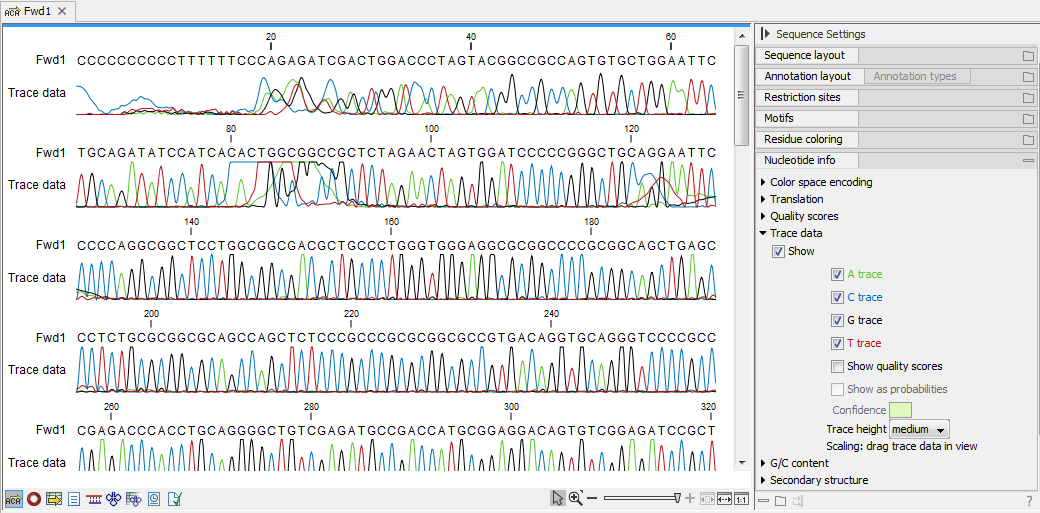
Trace settings in the Side Panel
In the Nucleotide info preference group the display of trace data can be selected and unselected. When selected, the trace data information is shown as a plot beneath the sequence. The appearance of the plot can be adjusted using the following options (see figure 19.3):
- Nucleotide trace. For each of the four nucleotides the trace data can be selected and unselected.
- Scale traces. A slider which allows the user to scale the height of the trace area. Scaling the traces individually is described in Scale traces.

Figure 19.3: A sequence with trace data. The preferences for viewing the trace are shown in the Side Panel.
When working with stand-alone mappings containing reads with trace data, you can view the traces by turning on the trace setting options as described here and choosing Not compact in the Read layout setting for the mapping.
