RNA-Seq results
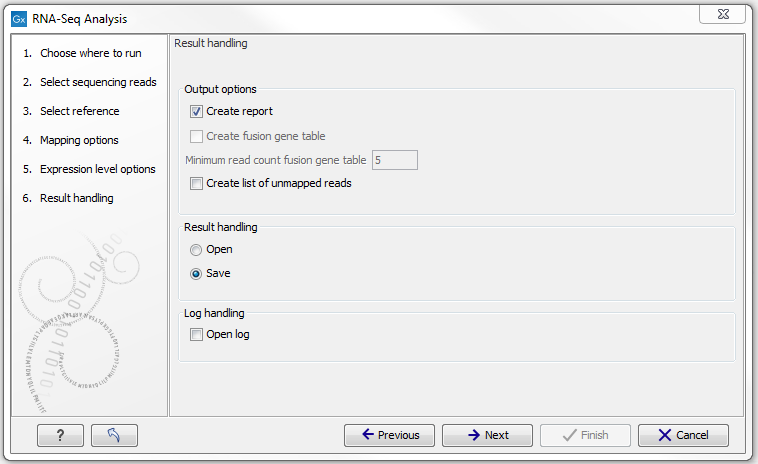
Clicking Next will allow you to specify the output options as shown in figure 27.9.

Figure 27.9: Selecting the output of the RNA-Seq analysis.
The main results of the RNA-Seq analysis are two expression tracks (one for gene-level and one for transcript-level expression) and a mapping track. In addition, the following optional results can be selected:
- Create list of unmapped reads. Creates a list of the reads that either did not map to the reference at all or that were unspecific matches with more placements than specified (see Defining mapping options for RNA-Seq).
- Create report. Creates a report of the results. See RNA-Seq report below for a description of the information contained in the report.
- Create fusion gene table. An option that is enabled when using paired data. Creates a table that lists potential fusion genes. This, along with the Minimum read count, is described further below in section Gene fusion reporting.
The sections below elaborate on the report and the fusion gene table, and the main results are explained in detail in Interpreting the RNA-Seq analysis result.
RNA-Seq report
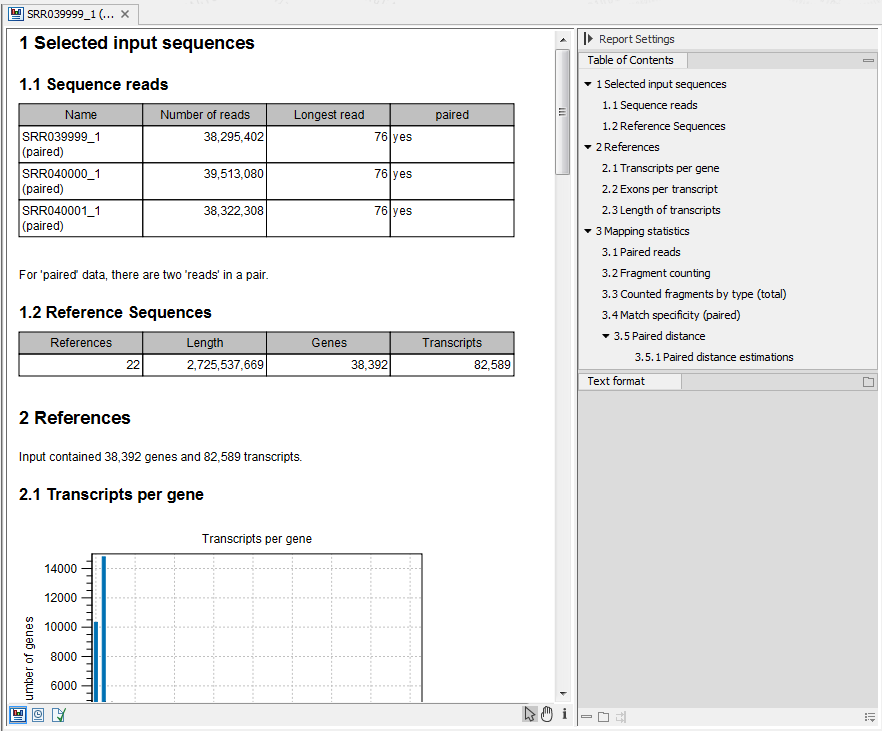
An example of the result of the option Create report is shown in figure 27.10.

Figure 27.10: Report of an RNA-Seq run.
The report contains the following information:
- Sequence reads. Information about the number of reads.
- Reference sequences. Information about the reference sequences used and their lengths.
- Reference. Information about the total number of genes and transcripts (for eukaryotes only) found in the reference.
- Transcripts per gene. A graph showing the number of transcripts per gene. For eukaryotes, this will be equivalent to the number of mRNA annotations per gene annotation.
- Exons per transcript. A graph showing the number of exons per transcript.
- Length of transcripts. A graph showing the distribution of transcript lengths.
- Mapping statistics. Shows statistics on:
- Paired reads. (Only included if paired reads are used). Shows the number of reads mapped in pairs, the number of reads in broken pairs and the number of unmapped reads.
- Fragment counting. Lists the total number of fragments used for calculating expression, divided into uniquely and non-specifically mapped reads (see the point below on match specificity for details).
- Counted fragments by type. Divides the fragments that are counted into different types
- Exon. Reads that map completely within an exon
- Exon-exon reads. Reads that map across an exon junction as specified in figure 27.12.
- Total exon reads. Number of reads that fall entirely within an exon or in an exon-exon junction.
- Intron. Reads that fall partly or entirely within an intron.
- Total gene reads. All reads that map to the gene.
- Intergenic. All reads that map partly or entirely between genes (will only be shown if the Also map to inter-genic regions option is used).
- Match specificity. Shows a graph of the number of match positions for the reads. Most reads will be mapped 0 or 1 time, but there will also be reads matching more than once in the reference. The maximum number of match positions is limited in the Maximum number of hits for a read setting in figure 27.4. Note that the number of reads that are mapped 0 times includes both the number of reads that cannot be mapped at all and the number of reads that matches to more than the Maximum number of hits for a read parameter.
- Paired distance. (Only included if paired reads are used). Shows a graph of the distance between mapped reads in pairs.
Gene fusion reporting
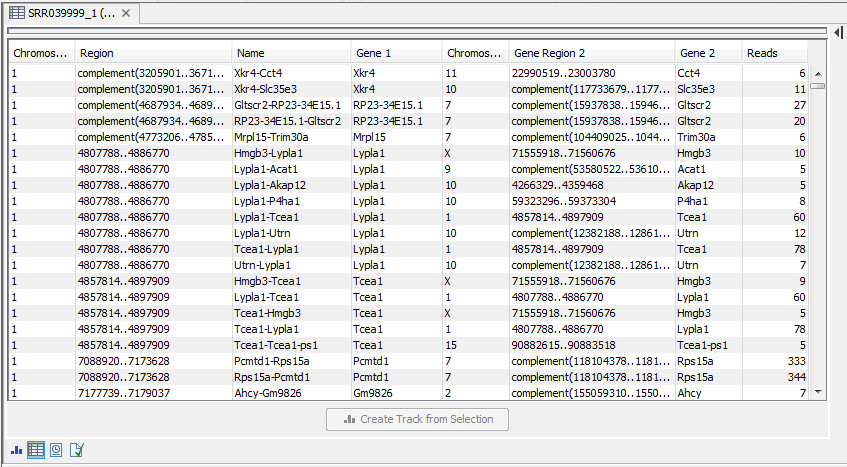
When using paired data, there is also an option to create an annotation track summarizing the evidence for gene fusions. An example is shown in figure 27.11.

Figure 27.11: An example of a gene fusion table.
Each row represents one gene where read pairs suggest it could be fused with another gene. This means that each fusion is represented by two rows.
The Minimum read count option in figure 27.9 is used to make sure that only combinations of genes supported by at least this number of read pairs are included. The default value is 5, which means that at least 5 pairs need to connect two genes in order to report it in the result.
The result table shows the following information for each row:
- Name. The name of the fusion (the two gene names combined).
- Information per gene. Gene name, chromosome and position are included for both genes.
- Reads. How many reads that are mapped across the two genes.
File | New | Track List (![]() )
)
