Creating graph tracks
Graph tracks can be created from sequences and mappings using the tools in the Toolbox:
Toolbox | Track Tools (![]() ) | Graphs
) | Graphs
Graph tracks can also be created directly from the track view or track list view by right-clicking the track you wish to use as input, which will give access to the toolbox.
The Create GC Content Graph tool needs a sequence track as input and will create a graph track with the GC contents of that sequence.
This track can then be displayed together with the sequence and other tracks in a track list.
The Create Mapping Graph can create the following graphs from a mapping track (see figure 24.28).
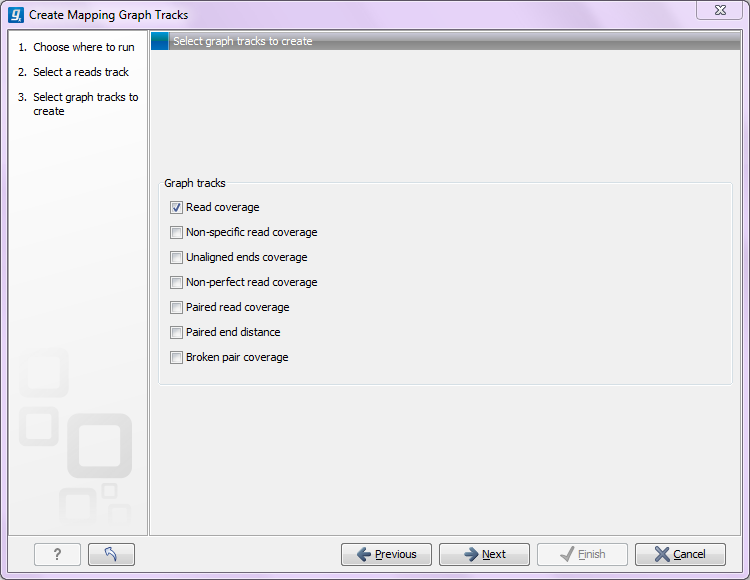
Figure 24.1: Creating graph track from mappings.
- Read coverage. For each position this graph shows the number of reads contributing to the alignment (see a more elaborate definition in Reference sequence statistics).
- Non-specific read coverage. Non-specific reads are reads that would fit equally well other places in the reference genome.
- Unaligned ends coverage. Un-aligned ends arise when a read has been locally aligned to a reference sequence, and then end of the read is left unaligned because there are mismatches or gaps relative to the reference sequence. This part of the read does not contribute to the read coverage above. The unaligned ends coverage graph shows how many reads that have unaligned ends at each position.
- Non-perfect read coverage. Non-perfect reads are reads with one or more mismatches or gaps relative to the reference sequence.
- Paired read coverage. This lists the coverage of intact pairs. If there are no single reads and no pairs are broken, it will be the same as the standard read coverage above.
- Broken pair coverage. A pair is broken either because only one read in the pair matches, or because the distance or relative orientation between the reads is wrong.
- Paired end distance. Displays the average distance between the forward and the reverse read in a pair. A pair contributes to this graph from the beginning of the first read to the end of the second read.
The Identify Graph Threshold Areas tool uses graph tracks as input to identify graph regions that fall within certain limits (thresholds). Both a lower and an upper threshold can be specified to create an annotation track for those regions of a graph track where the values are in the given range (see figure 24.29). Consequently, in order to identify only those parts of the track that exceed a certain minimum, one would choose the minimum threshold and set the upper limit to a value well above the maximum occurring in the track (and vice versa for finding ranges that are below a maximum threshold). Obviously, the range chosen for the lower and upper thresholds will depend on the data (coverage, quality etc.).
The "window-size" parameter specifies the width of the window around every position that is used to calculate an average value for that position and hence "smoothes" the graph track beforehand. A window size of 1 will simply use the value present at every individual position and determine if it is within the upper and lower threshold, hence resulting in the same "non-smoothing" behavior as previous versions of the workbench without this parameter. In contrast, a window size of 100 checks if the average value derived from the surrounding 100 positions falls between the minimum and maximum threshold. Such larger windows help to prevent "jumps" in the graph track from fragmenting the output intervals or help to detect over-represented regions in the track that are only visible when looked at in the context of larger intervals and lower resolution. An example output is shown in figure 24.30 where the coverage graph has a couple of local minima near zero. However, by using the averaging window, the tool is able to produce a single unbroken annotation covering the entire region. Of course larger window sizes result in regions that are broader and hence their boundaries are less likely to exactly coincide with the borders of visually recognizable borders of regions in the track.
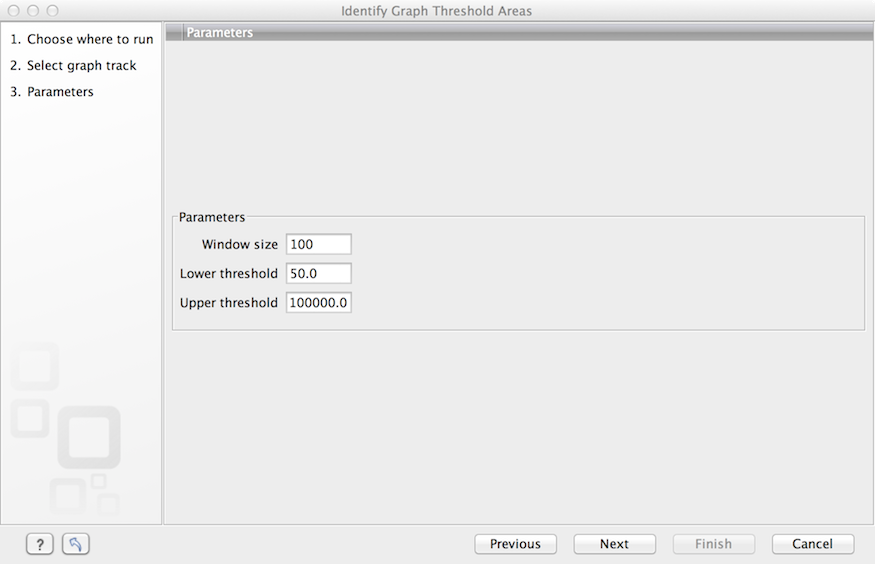
Figure 24.2: Specification of lower and upper thresholds.
When zoomed out, the graph tracks are composed of three curves showing the maximum, mean, and minimum value observed in a given region (see figure 24.30). When zoomed in all the way down to base resolution only one curve will be shown reflecting the exact observation at each individual position.
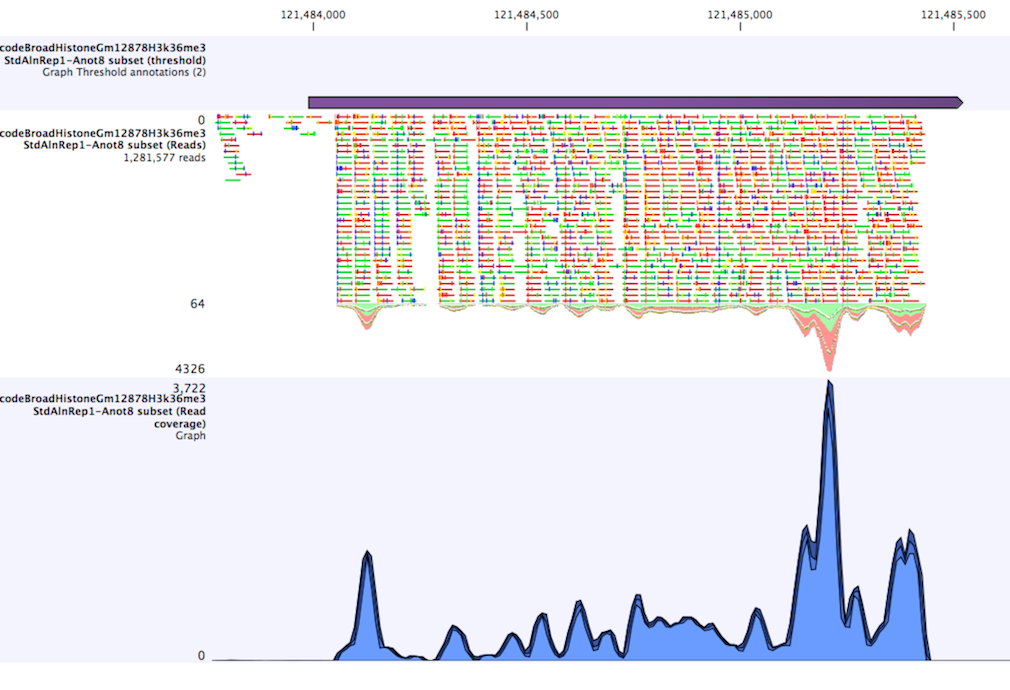
Figure 24.3: Track list including a region identified by the parameters set above on a dataset of H3K36 methylation from ENCODE. The top track shows the resulting region. Below is the track containing the reads. The graph track at the bottom shows the coverage with the minimum, mean, and maximum observed values.