Immune Repertoire
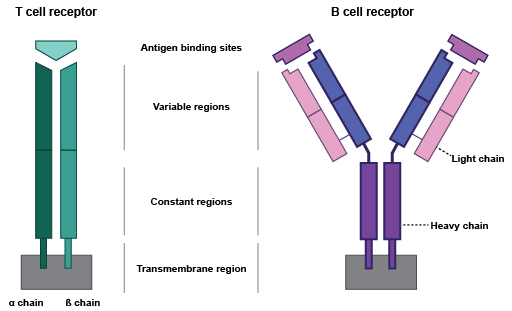
Figure 13.1: T and B cell receptors structure. Each pair of chains forms an antigen binding site that binds to specific antigens.
T and B cells form our acquired immune response. They both contain highly variable receptors (see figure 13.1) with binding sites that recognize antigens.
T and B cell receptors (TCR and BCR, respectively) are composed of multiple polypeptide chains: TCRs contain one pair, while BCRs contain two copies of a pair:
- TCR:
 (TRA) and
  (TRB), or
  (TRG) and
  (TRD).
- BCR: light and heavy. There are two types of light chains in humans:
 (IGK) and
  (IGL), while other animals also contain other types of light chains. Once set, the light chain class remains fixed for the life of the B cell. There are five types of heavy chains (IGH) for mammals: , , ,
  and
and  , defining the class of the receptor.
The chains are encoded by genes that undergo somatic recombination. During this process, gene segments are joined with random nucleotides at the junction sites. There are two types of recombination (see figure 13.2):
- VJ recombination, where one V (variable) gene segment is joined to a J (joining) gene segment;
- VDJ recombination, where a D (diversity) gene segment is added between the V and J gene segments.
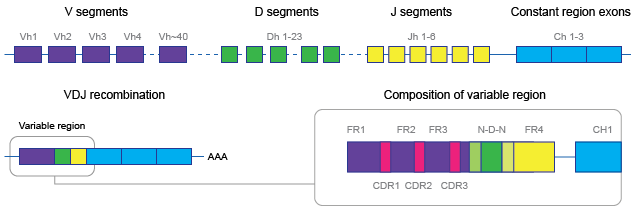
Figure 13.2: VDJ recombination brings together a V, D, J and C gene segment.
For both types of recombination, a C (constant) gene segment is also added following the J segment.
The TRA and TRG chains are the result of VJ recombination, while the TRB and TRD chains are the result of VDJ recombination. The V, D, J and C gene segments are specific for each TCR chain type.
BCR light chains are the result of VJ recombination, while BCR heavy chains are the result of VDJ recombination. BCR heavy chains have three to four C gene segments. The V, D, J and C gene segments are specific for each BCR light chain type, while they are shared by the BCR heavy chains.
Each chain contains three "complementary-determining regions" (CDRs) (figure 13.2) which form loops in the antigen binding sites. The V(D)J recombination junction is located in the third CDR (CDR3). Due to inclusion of random nucleotides at the junctions between segments, the CDR3 is the most diverse among the three CDRs. Its beginning and end are marked by a conserved cysteine (C) and phenylalanine/tryptophan (F/W) amino-acid in the V and J segments, respectively.
CLC Single Cell Analysis Module offers tools to clonotype reads and characterize the T or B cell receptor repertoire (Single Cell V(D)J-Seq Analysis), filter the repertoires (Filter Cell Clonotypes), combine them across samples (Combine Cell Clonotypes), compare them (Compare Cell Clonotypes) and convert them to cell annotations (Convert Clonotypes to Cell Annotations) for easy visualization on Dimensionality Reduction Plots.
Here, clonotyping consists of identifying which V, D, J and C segments from the reference data (Single Cell V(D)J-Seq Analysis) are used, and extracting the CDR3 region found between the conserved amino acids.
Subsections
- Single Cell V(D)J-Seq Analysis
- The Cell Clonotypes element
- Filter Cell Clonotypes
- Combine Cell Clonotypes
- Compare Cell Clonotypes
- Convert Clonotypes to Cell Annotations