Alpha Diversity
Alpha diversity is the diversity within a particular area or ecosystem; usually expressed by the number of species (i.e., species richness) in that ecosystem. Alpha diversity estimates are dependent on sampling depth, and hence rarefaction analysis is integral to this analysis step. Before you run the tool, you must have aligned the OTUs and constructed a phylogeny.
To run the tool go to
Toolbox | Microbial Genomics Module (![]() ) | OTU clustering (
) | OTU clustering (![]() ) | Alpha Diversity (
) | Alpha Diversity (![]() )
)
Choose an OTU table to use as input. The next wizard window offers you to set up different analysis parameters (figure 4.2). For example, you can select which diversity measures to calculate, specify the appropriate phylogenetic tree for computing phylogenetic diversity, and parameterize the rarefaction analysis.
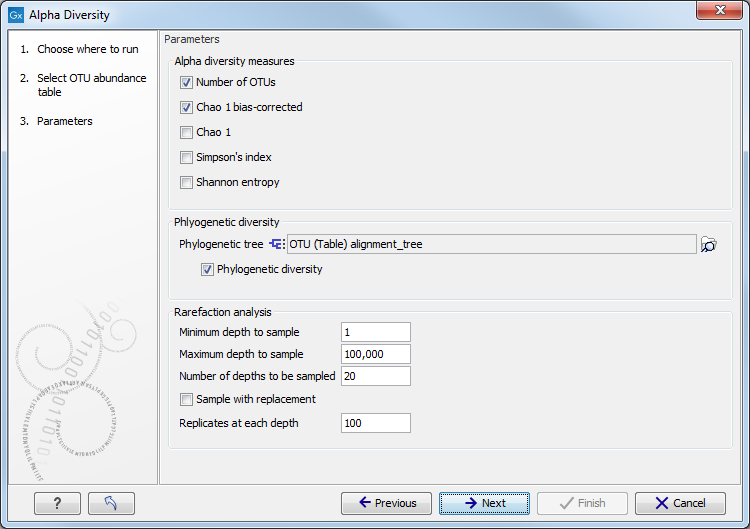
Figure 4.2:
Set up parameters for the Alpha Diversity tool.
The rarefaction analysis is done by sub-sampling the OTU abundances in the different samples at different depths. The range of depths to be sampled is defined by the parameters Minimum depth to sample and Maximum depth to sample. If the maximum depth is set to 0, the number of reads of the most abundant sample is used. The number of different depths to be sampled is specified by the Numbers of depths to be sampled parameters. For example, if you choose to sample 5 depths between 1000 and 5000, the algorithm will sub-sample each sample at 1000, 2000, 3000, 4000, and 5000 reads. At each depth, the algorithm subsamples the data several times, according to the Replicates at each depth. You can choose whether the sampling should be performed with or without replacement by setting the Sample with replacement parameter.
The tool will generate a graph for each selected "Alpha diversity measure" (figure 4.3). Using the Lines and dots editor on the right hand side panel, it is possible to color samples according to groups defined by associated metadata.
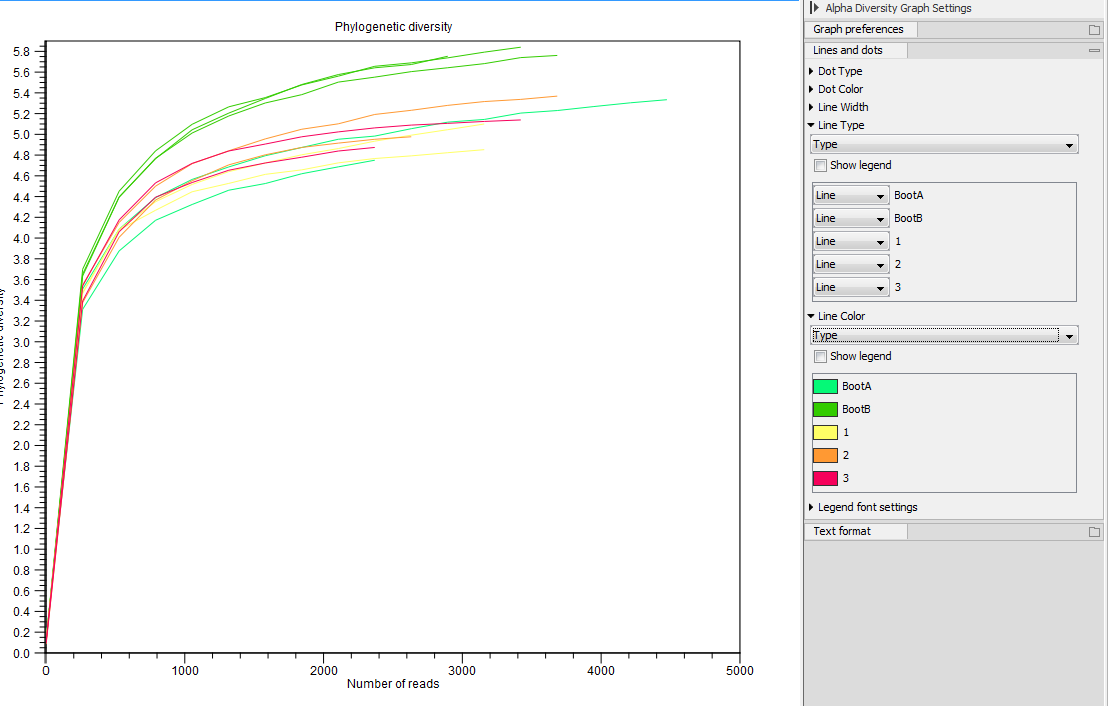
Figure 4.3:
An example of Alpha Diversity graph based on phylogenetic diversity.
Subsections