ANOVA
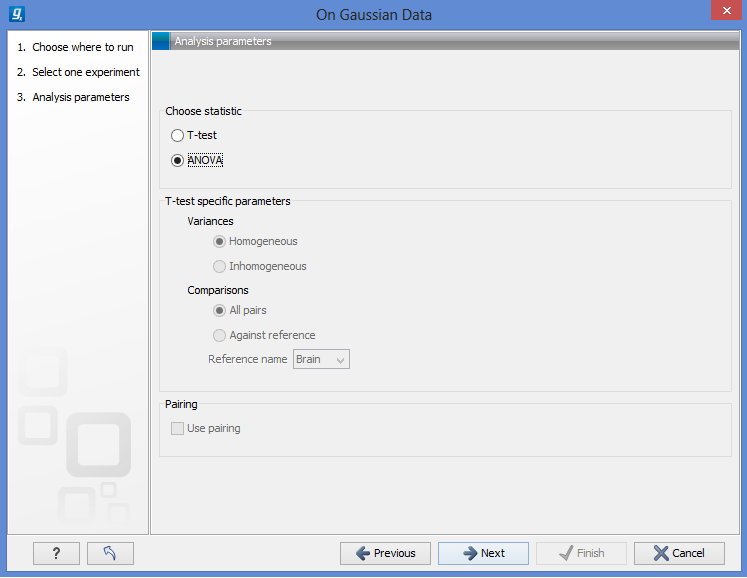
For experiments with more than two groups you can choose T-test as described here, or ANOVA as shown in figure 19.41.

Figure 19.41: Selecting ANOVA.
The ANOVA method allows analysis of an experiment with one factor and a number of groups, e.g. different types of tissues, or time points. In the analysis, the variance within groups is compared to the variance between groups. You get a significant result (that is, a small ANOVA p-value) if the difference you see between groups relative to that within groups, is larger than what you would expect, if the data were really drawn from groups with equal means.
If an experiment with pairing was set up (see Set up experiment) the Use pairing tick box is active. If ticked, a repeated measures one-way ANOVA test will be calculated, if not, the formula for the standard one-way ANOVA will be used.
When an ANOVA analysis is run on an experiment four columns will be added to the experiment table for each pair of groups that are analyzed. The 'Max difference' column contains the difference between the maximum and minimum of the mean expression values of the groups, multiplied by -1 if the group with the maximum mean expression value occurs before the group with the minimum mean expression value (with the ordering: group 1, group 2, ...). The 'Max fold change' column contains the ratio of the maximum of the mean expression values of the groups to the minimum of the mean expression values of the groups, multiplied by -1 if the group with the maximum mean expression value occurs before the group with the minimum mean expression value (with the ordering: group 1, group 2, ...). The 'Test statistic' column holds the value of the test statistic, and the 'P-value' holds the two-sided p-value for the test. Up to two more columns may be added if the options to calculate Bonferroni and FDR corrected p-values were chosen (see 19.4.4).
