QIAseq miRNA Quantification outputs
The tool will output expression tables. The "Grouped on mature" table has a row for each mature miRNA. The same mature miRNA may be produced from different precursor miRNAs. The "Grouped on seed" table has a row for each seed sequence. The same seed sequence may be found in different mature miRNAs. If a custom database was provided, a "Grouped on custom database" will be added to the output folder.
Grouped on seed
(In this expression table, there is a row for each seed sequence (figure 12.6). This file is useful for further analysis in Ingenuity Pathway Analysis (IPA). It can be directly uploaded to IPA if the Ingenuity Pathway Analysis plugin is installed and you have an active license for IPA.
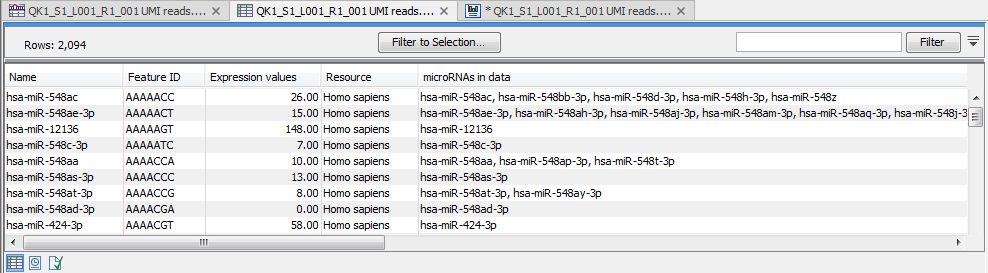
Figure 12.6: Expression table grouped on seed.
This table contains the following information:
- Name An example of an expressed mature miRNA that has this seed sequence.
- Feature ID The sequence of the miRNA seed
- Expression value Counts
- Resource The database used for identifying miRNAs. For miRBase the species name will be shown.
- microRNAs in data A complete list of expressed mature miRNAs with this seed sequence
Grouped on mature
(In this table, there is a row for each mature miRNA in the database, including those for which the expression is zero (figure 12.7). Double click on a row to open a unique reads alignment (seen at the bottom of figure 12.7). Unique reads result from collapsing identical reads into one. The number of reads that are collapsed into a unique read is indicated in parentheses to the right of the miR name of the unique mature read. The alignment shows all possible unique reads that have aligned to a specific miRNA from the database. Mismatches to the mature reference are highlighted in the alignment and recapitulated in their name as explained in Naming isomiRs.
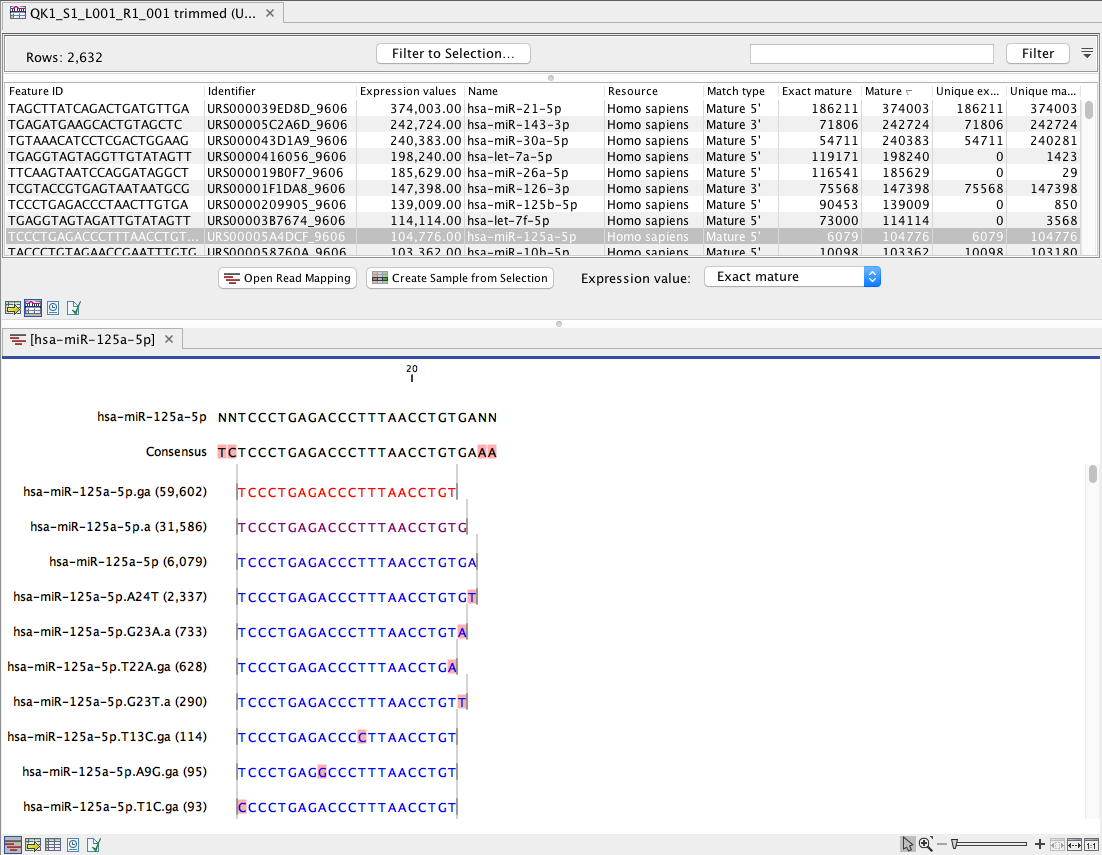
Figure 12.7: Expression table grouped on mature, with a view of a unique reads alignment.
This table contains the following information:
- Feature ID Sequence of the mature miRNA
- Identifier The RNAcentral Accession of the mature miRNA
- Expression value Counts in the Mature column
- Name Name of the annotation sequence
- Resource This is the source of the annotation. For miRBase the species name will be shown.
- Match type Mature 5' or Mature 3'
- Exact mature Number of mature reads that exactly match the miRBase sequence.
- Mature Number of all mature reads, i.e., exact and variants
- Unique exact mature In cases where one read has several hits, the counts are distributed evenly across the references. The difference between Exact mature and Unique exact mature is that the latter only includes reads that are unique to this reference.
- Unique mature Same as above but for all mature, including variants
Grouped on custom database
(In this table, there is a row for each mature smallRNA in the database, including those for which the expression is zero (figure 12.8). Double click on a row to open a unique reads alignment (seen at the bottom of figure 12.8). Unique reads result from collapsing identical reads into one. The number of reads that are collapsed into a unique read is indicated in parentheses to the right of the miR name of the unique mature read. The alignment shows all possible unique reads that have aligned to a specific miRNA from the database. Mismatches to the mature reference are expressed according to a gradient that can be changed in the Side Panel.
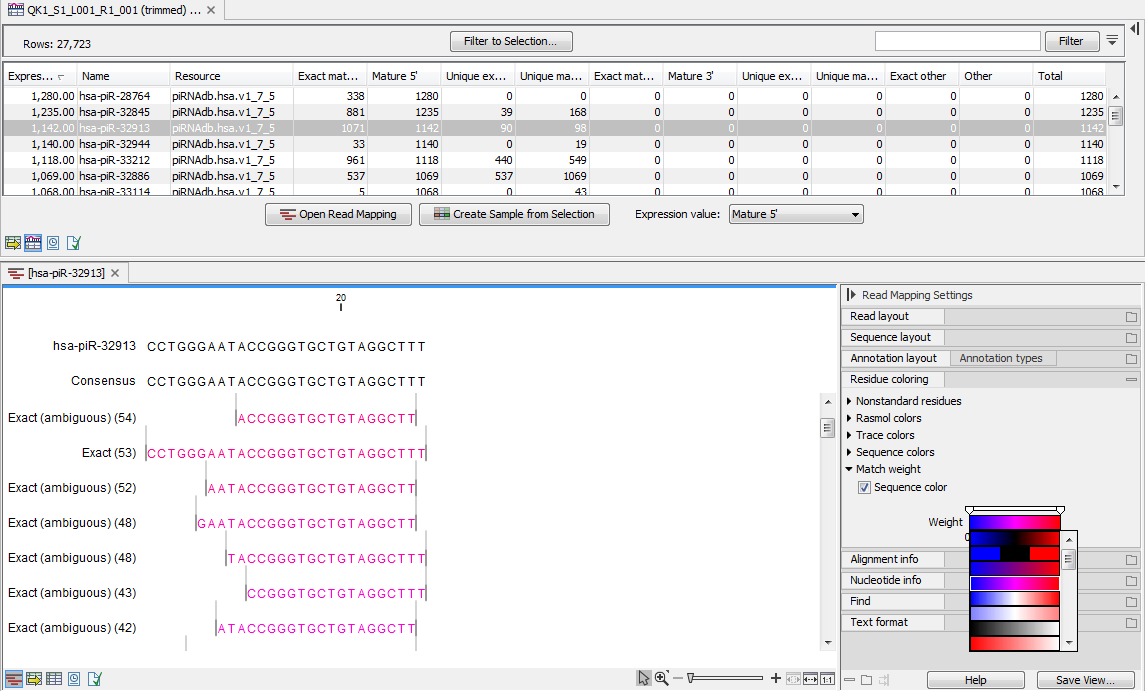
Figure 12.8: Expression table grouped on custom database, with a view of a unique reads alignment.
This table contains the following information:
- Feature ID Sequence of the mature miRNA
- Expression values Counts in the Mature column
- Name Name of the annotation sequence
- Resource This is the source of the annotation, usually the name of the custom database input.
- Exact mature Number of reads matching to a subsequence of the custom database reference.
- Mature Number of reads matching to a subsequence of the custom database reference where mismatches are allowed (within the limit of what was specified in the wizard during configuration)
- Unique exact mature In cases where one read has several hits, the counts are distributed evenly across the references. The difference between Exact mature and Unique exact mature is that the latter only includes reads that are unique to this reference.
- Unique mature Same as above but for all mature, including variants
- Exact other Always 0
- Other Always 0
- Total
Reports and discarded reads
The workflow also outputs reports:
- A trimming report, only relevant when working with Ion Torrent reads
- A UMI Report that indicates how many reads were ignored and the reason why they were not included in a UMI read. Discarded reads are also output for review.
- A Quantification report
The quantification report contains the following main sections:
- Quantification summary, with information of the number of features that were annotated in the sample.
- Spike-ins, a statistical summary of the reads mapping to the spike-ins (only when spike-ins were enabled).
- Unique search sequences counts, a small RNA reads count distribution.
- Map and Annotate, with Summary, Resources, Unique search sequences, Reads, Read count proportions and Annotations (miRBase).
- Reference sequences, a table with the Top 20 mature sequences, and a table with the Top custom databases sequences when one was provided.
- Seeds report, with tables listing the Top 20 seeds (reference) and Top 20 novel seeds.
It is later possible to combine all reports issued for one sample using the Create Combined miRNA Report tool (see http://resources.qiagenbioinformatics.com/manuals/clcgenomicsworkbench/current/index.php?manual=Create_Combined_miRNA_Report.html.