Refine Fusion Genes
Refine Fusion Genes takes as input the fusions identified by the Detect Fusion Genes tool, and re-counts the number of fusion crossing reads as well as the wildtype supporting reads using the RNA-Seq mapping against the wild type and fusion references. The fusion reference is an artificial reference sequence that "assumes" the detected fusions by generating new chromosomes corresponding to each fusion in addition to the original chromosomes (figure 6.16).
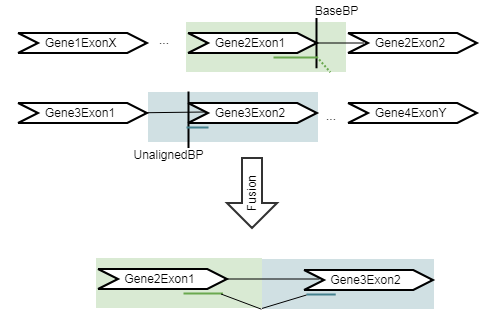
Figure 6.16: An artificial chromosome is created consisting of the vicinity of both ends of the fusion..
The RNA-Seq Analysis tool is used to re-map the reads to the artificial reference, with the expectation that reads that were used to detect the fusion will now map to the fusion transcript with a spliced read. In addition, some reads that did not originally map at all will now map to the artifical reference sequence, increasing evidence for the fusion event. The tool then calculates the "refined" Z-score and p-value using the same binomial model as the Detect Fusion Genes tool.
Refine Fusion Genes can be found in the Toolbox at:
Tools | QIAseq Panel Expert Tools (![]() ) | QIAseq RNAscan Panel Expert Tools (
) | QIAseq RNAscan Panel Expert Tools (![]() ) | Refine Fusion Genes (
) | Refine Fusion Genes (![]() )
)
It takes a fusion track as input (figure 6.17).
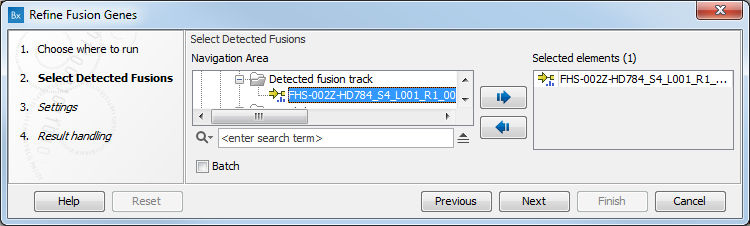
Figure 6.17: Select a fusion track.
The next dialog allows you to configure the following parameters (figure 6.18):
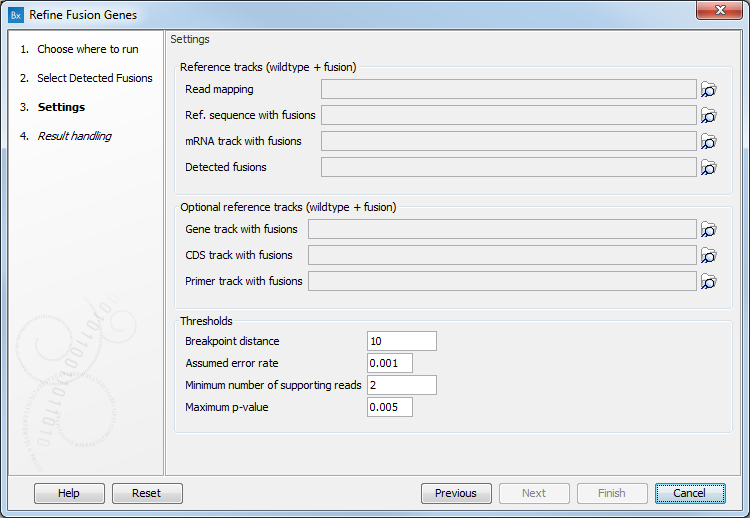
Figure 6.18: Set the parameters for the Refine Fusion Genes tool.
- Reference tracks (wildtype + fusion): Specify a read mapping, a reference sequence with fusions, a mRNA track with fusions, or a detected fusions track: these files are output by the Define Fusion Genes.
- Optional reference tracks (wildtype + fusion): You can also add a Gene track, CDS track or Primer track with fusions
- Thresholds:
- Breakpoint distance: Minimum distance from a read mapping exon position to a fusion breakpoint position required to count a read as supporting.
- Assumed error rate: Probability of an unaligned end mapping to another gene by random.
- Minimum number of supporting reads that should support a fusion. Fusions with fewer supporting reads will get a corresponding filter annotation.
- Maximum p-value: Fusions with p-value above this threshold will get a corresponding filter annotation.
The Refined fusion gene report
The principal output of Refine Fusion Genes is a report listing only those fusions with FILTER=PASS. Each Fusion Gene is described by two tables and a fusion plot (figure 6.19).
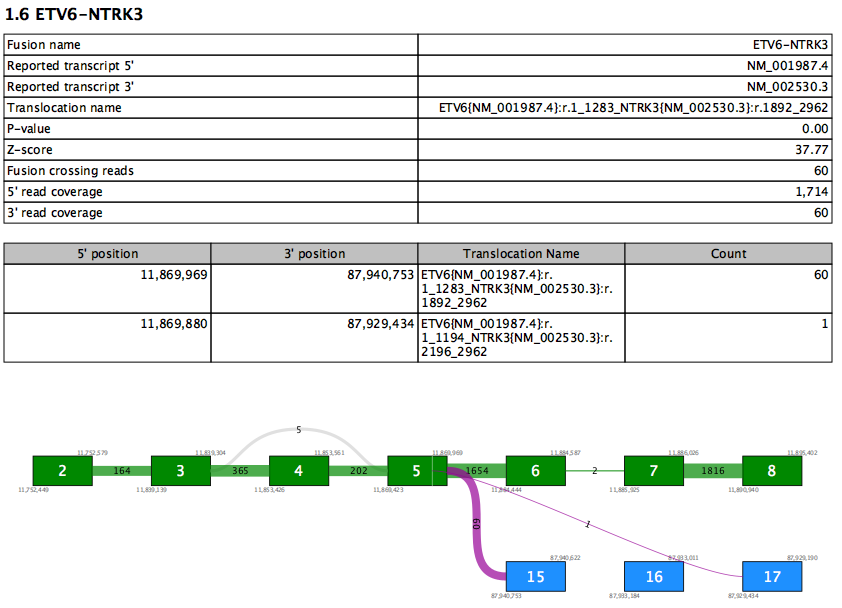
Figure 6.19: A report section for a fusion gene.
The first table contains an overview of the most supported fusion for the fusion gene. Values in this table include:
- Reported transcript 5'/3' - the reported transcript is the highest priority transcript that is compatible with this fusion
- Translocation name - HGVS description of the fusion against the reported transcripts
- Fusion crossing reads - the number of reads that splice from the 5' exon and into the 3' exon
- 5'/3' read coverage - the total number of reads that splice at the 5'/3' exon. This number is therefore always at least as high as fusion crossing reads.
The second table lists values for all supported fusion breakpoints in the fusion gene, sorted by read count. Therefore the first row in the table recapitulates some of the values from the first table. Additional rows show evidence for other fusions between the same two genes. At most 10 rows are shown.
The fusion plot visualizes all fusions between the reported transcripts.
- Green box - an exon in the 5' reported transcript
- Blue box - an exon in the 3' reported transcript
- Gray box - an exon that is not in the reported transcript. This may be present in other transcripts, or may represent a novel exon not seen in any transcript.
- Purple lines - fusion connections. The number of reads supporting the fusion is written on the line. Note that it is possible for a fusion present in the second table to be absent here if that fusion is between exons not present in the reported transcripts.
- Gray lines - connections due to alternative splicing between exons in the reported transcript. The number of reads splicing between the exons is shown on each line.
- White vertical lines within green or blue boxes - indicate that fusion reads spliced > 12nt into the exon rather than at the exon boundary
Another output is a fusion track, described in the next section.
Fusion tracks
The fusion track has a table view containing the following information:
- Chromosome. Chromosome where "Gene" and "Transcript" are located.
- Region. Breakpoint position of the fusion event relative to the reference sequence hg38.
- Name. Short name of the fusion event, 5' gene-3' gene.
- Fusion number. Numbers rows that describe fusions between the same two genes.
- Fusion pair. Numbers pairs of fusion breakpoints for a given fusion number.
- 5' or 3' Gene. The fusion gene that corresponds to the "Chromosome" and "Region" fields.
- Breakpoint type. 3' or 5'.
- Fusion Crossing Reads. Number of reads crossing the fusion breakpoint.
- 5' or 3' Read Coverage. Number of reads (unaligned ends and pairs) that cover the 5' or 3'-transcript breakpoint, including normal transcripts and fusion transcripts.
- Z-score. Converted from the P-value using the inverse distribution function for a standard Gaussian distribution.
- P-value. A measure of certainty of the call calculated using a binomial test, it is calculated as the probability that an observation indicating a fusion event occurs by chance when there is no fusion. The closer the value is to 0, the more certain the call. Although one should avoid strictly interpret the p-value as the true false positive rate, our test data show that the p-value seems to be appropriately calibrated using standard parameter settings.
- Filter. Contains the names of the filters applicable to the fusion, or the value "PASS" if it passed all filters.
- Translocation Name. Description of the fusion in the HGVS format (http://cancer.sanger.ac.uk/cosmic/help/fusion/summary) using the preferred transcript.
- Exon skipping. Whether the fusion is a same-gene fusions where the 5' breakpoint is upstream of the 3' breakpoint.
- Fusion with novel exon boundaries. Indicates if one or both fusion breakpoints are at a novel exon boundary.
- Found in-frame CDS. This column is present when a CDS track was specified as input. It contains "Yes" if at least one fusion CDS that stays in frame across the fusion breakpoints has been found. Note that the in-frame calculation only takes into account the frame of the last included exon in the 5' gene and the first included exon in the 3' gene, and ignores more complex factors that might affect frame, such as frameshift mutations or stop codons due to variants around the fusion breakpoints.
- Compatible Transcripts. All known transcripts with which the fusion reads are compatible. Transcripts are 'compatible' with fusion reads if they include the exon boundary at which the fusion occurs. If there are no known compatible transcripts then an artificial transcript will be listed with a name such as "10-gene27693-32015547-BEGINNING-0" This shows that the transcript was created for gene27693 on chromosome 10, by modifying the beginning of an existing exon, in order to describe a breakpoint at position 32015547 (the final "0" is just a counter).
- Original chromosome. (only in tracks based on a fusion reference)
- Original breakpoint region. (only in tracks based on a fusion reference)
- Known Fusion. Indicates the Fusion ID Number of the matching fusion in the known fusion database. If the fusion is not found in the database, then -1 is reported. By default, the tool uses a QIAGEN known fusion database, but you can replace this database with another known fusions database relevant to your assay. Note that this database is not used to detect the fusions, but only for annotating the identified fusions output from the Detect Fusion Genes before refinement.
- Fusion Plot. Contains a link to a QIMERA fusion plot. Click on the link to open the plot.
The main differences in the fusion tracks produced by Refine Fusion Genes when compared to those produced by Detect Fusion Genes are:
- The p-value, Z-score, and read counts are recalculated based on the supplied read mapping.
- A FILTER column is added where fusions "PASS" only if they fulfill the specified p-value and minimum number of fusion crossing reads requirements