Calculate Unique Molecular Index Groups
The tool Calculate Unique Molecular Index Groups annotates the mapped reads with a "Unique Molecular Index group ID", that is identical for reads that are determined to belong to the same UMI. The tool can be found in the Toolbox here:
Tools | QIAseq Panel Expert Tools (![]() ) | QIAseq DNA Panel Expert Tools (
) | QIAseq DNA Panel Expert Tools (![]() ) | Calculate Unique Molecular Index Groups (
) | Calculate Unique Molecular Index Groups (![]() )
)
In the first dialog (figure 5.36), select a read mapping of reads that were previously annotated with UMI annotations.
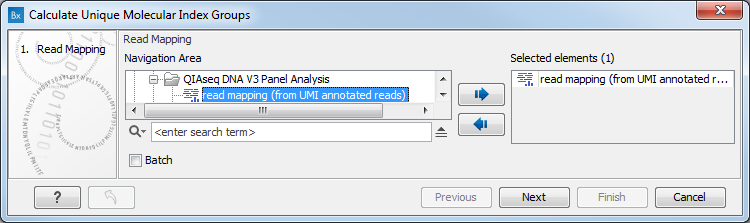
Figure 5.36: Select a read mapping made from reads whose UMI was removed and annotated on the sequences.
The grouping of reads into UMI groups works as follows:
- The tool groups reads that
- start at the same position based on the end of the read to which the UMI is ligated (i.e., Read2 for paired data),
- are from the same strand, and
- have identical UMIs.
- The tool then fuzzy merges singleton groups into non-singleton groups, if the UMI of the singleton group can be made into UMI of non-singleton group by introducing a SNP, and if the non-singleton group is the biggest of such group (i.e., if two different introduced SNPs yields two different non-singleton groups, the biggest one is chosen).
- Additional merging of singletons and small groups into bigger ones can happen depending on the parameters set for the tool.
It is possible to change the following parameters (figure 5.37):
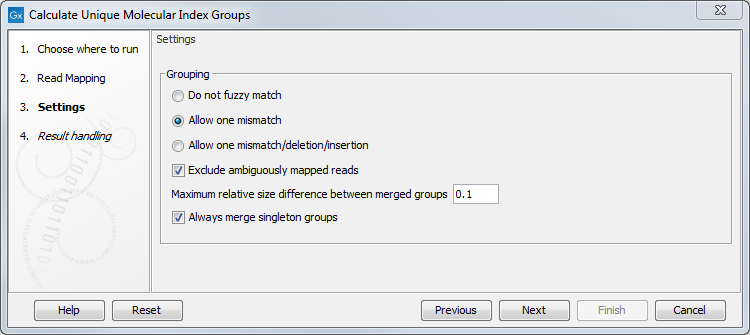
Figure 5.37: Select a read mapping made from reads whose UMI was removed and annotated on the sequences.
- Do not fuzzy match Groups will be merged only if they match exactly.
- Allow one mismatch Groups will be merged if they are at most one mismatch apart.
- Allow one mismatch/deletion/insertion Groups will be merged if they are at most one mismatch, deletion or insertion apart.
- Exclude ambiguously mapped reads is checked by default.
- Maximum relative size difference between merged groups will merge small groups into bigger ones if the size difference between the two groups is smaller than a certain value (set at 0.1 per default).
- Always merge singleton groups When this option is checked, a singleton UMI group is merged with a non-singleton group even if the "Maximum relative size difference between merged groups" threshold is not met.
Click Next to choose whether to Open or Save the resulting read mapping of reads which now have had a "UMI group ID" annotation.
It is also possible to choose to generate a UMI Groups report containing the following information:
- Reads in input: reads that were aligned to the reference
- Reads mapped multiple places (discarded): reads that aligned to the reference in multiple places, and thus discarded
- Groups merged
- Groups not merged due to >1 candidate of equals size
- Groups not merged due to parameter thresholds
- Number of groups that were too small (discarded)
- Number of reads in groups that were too small (discarded)
- Output groups
- Singleton groups
- Reads in largest group
- Number of UMI in most divergent group
- Average, Median and Standard deviation of reads per group
- 5, 20 or 30% biggest group size
- % of reads NOT in 5, 20 or 30% biggest size groups
- Groups with size x (% of groups) (% of reads)
The following graphs are also available:
- Group Sizes graphs, the first including all groups, and the second including only groups with less than 50 reads in them;
- Relative size of biggest group member (figure 5.38). This plot shows in percentage the number of reads that have the most commonly seen UMI sequence in a UMI group. First, UMI groups are created by grouping the reads that start at the same position, have the same strand, and have the exact same UMI. Since sequencing errors can happen in the UMI sequence, we then fuzzy merge singleton groups into non-singleton groups if the UMI of the singleton group can be made into UMI of non-singleton group by introducing one SNP, and if the non-singleton group is the biggest of such group. Furthermore, we merge small groups into bigger ones if the size difference between the two groups (number of reads in the small group divided with number of reads in the large group) is smaller than 0.1. Finally, we always try to merge singletons into a larger group. Hence, not all reads in a UMI group have the exact same sequence.
The x-axis of the plot shows the percentage of reads have the most common UMI sequence out of all reads in the group, calculated as reads the have most common UMI sequence in the UMI group divided by the number all reads in the group multiplied by 100 to get the value as a percentage. The values in the y-axis is counting UMI groups that have the percentage on the x-axis. Thus, the "Relative size of biggest group member (%)" plot show the percentage of reads in a UMI group that have the most common UMI sequence for the UMI group.
In the example below, we see that for most UMI groups (1725 UMI groups), 97% of the reads have the most common UMI sequence for the group. Furthermore, we see that in the most diverse UMI group only 22% of the reads in the group had the most common UMI sequence for that group.
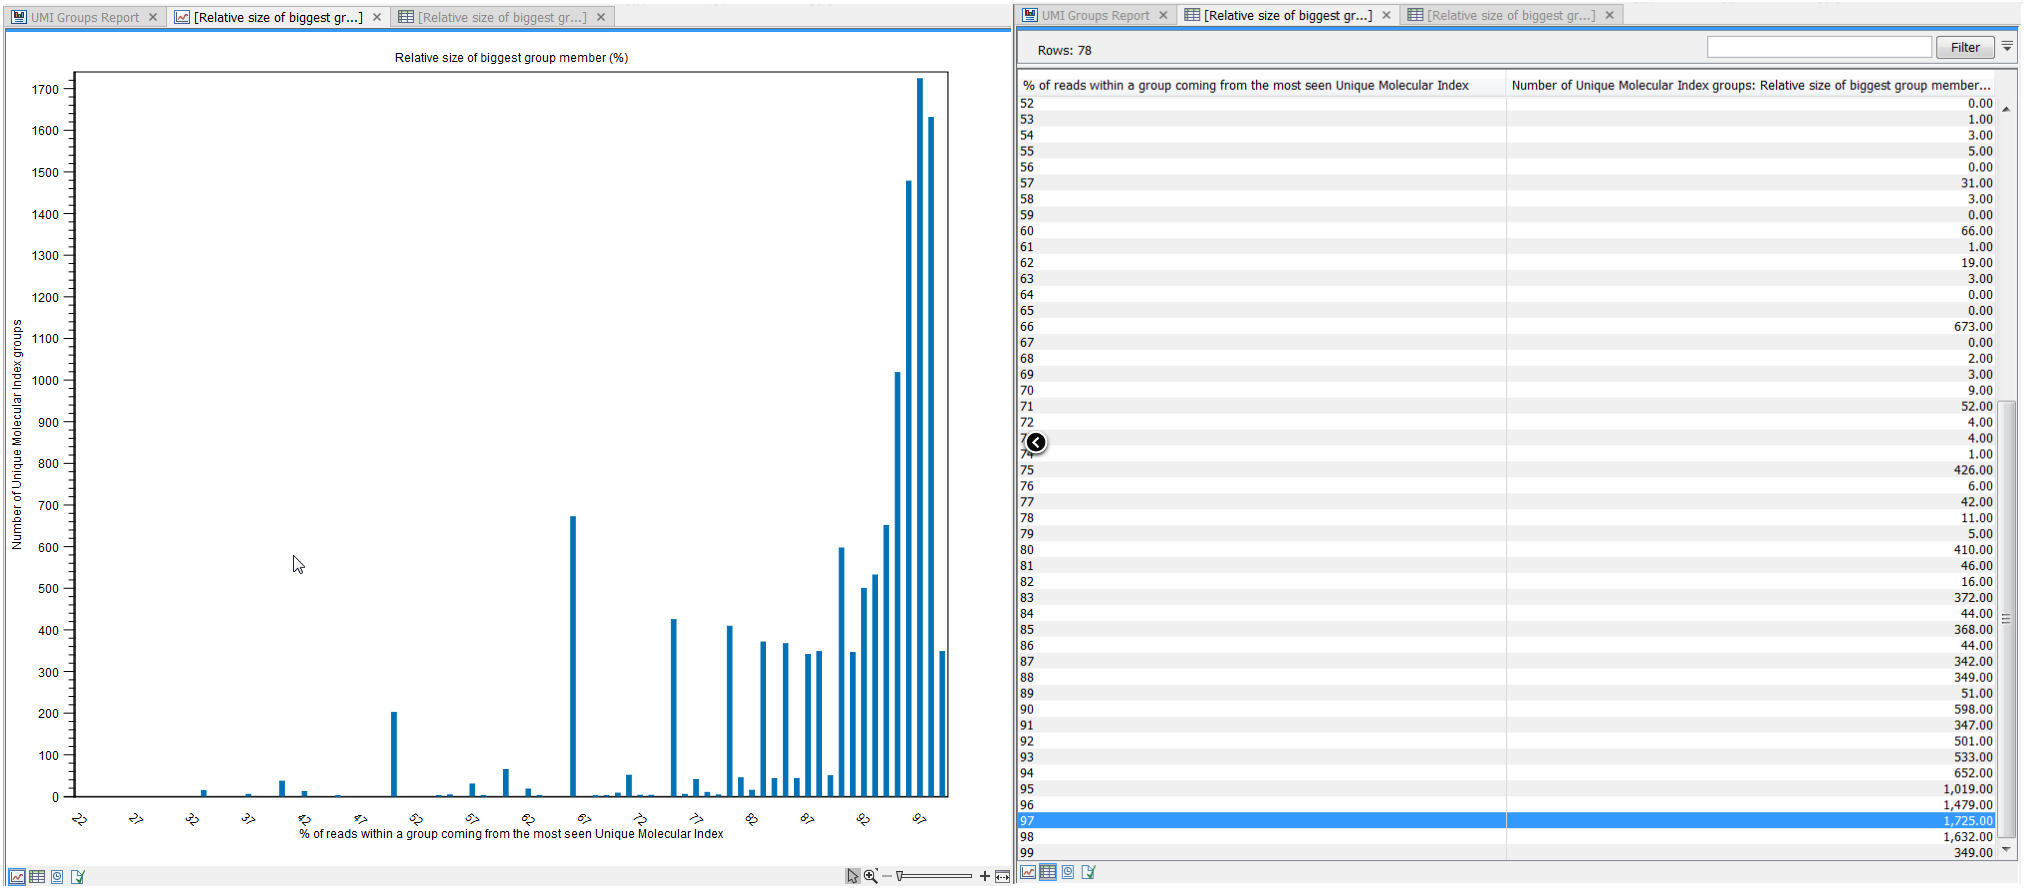
Figure 5.38: Relative size of biggest group member graph as seen in the UMI Groups Report: click on the plot to open it in a larger view, and view the values from the plot in the table view.