Output from the Detect QIAseq Methylation workflow
The Detect QIAseq Methylation workflow generates the following outputs:
- A Track List that includes - among others - the following tracks:
- A read mapping
- A target coverage track
- A methylation levels track
- Several reports (see figure 10.2)
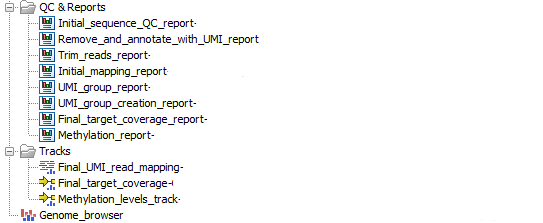
Figure 10.2: Reports generated by the workflow.
It is recommended to look at the Section 3 of the Methylation report in order to check that there are no problems with the bisulfite conversion reaction (see figure 10.3). The CHG and CHH values can be used as a proxy for the efficiency of bisulfite conversion, as most methylation in human samples is seen in CpG contexts (except for certain cell types [He and Ecker, 2016]). Typically CHG and CHH will be <2%.
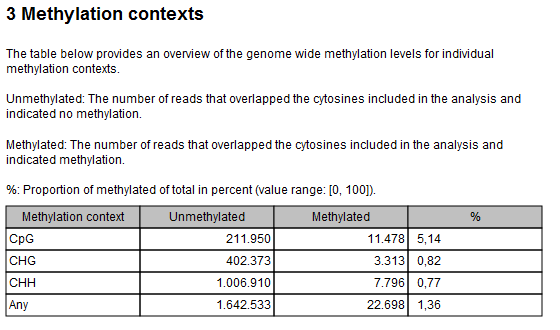
Figure 10.3: Methylation contexts table of the Methylation report.
Note that in Section 4 of the Methylation report, it is expected that most R1 related values are 0, as the primer is unaligned from the start of read 1, meaning that the first 25 bases are (almost) never aligned.
Also note that in the UMI Group Creation report, the last plot shows the "Nucleotide percentages of the unique molecular barcode symbols". This plot looks like the one defined as bad quality for Targeted DNA application (see Quality Control for the Identify QIAseq DNA Variants workflow). This is however expected in Targeted Methyl applications as the UMI for methylation is "NNCNNCNNCNN", meaning that red "C" bars follow a different distribution from the other nucleotides.