RNA-Seq report
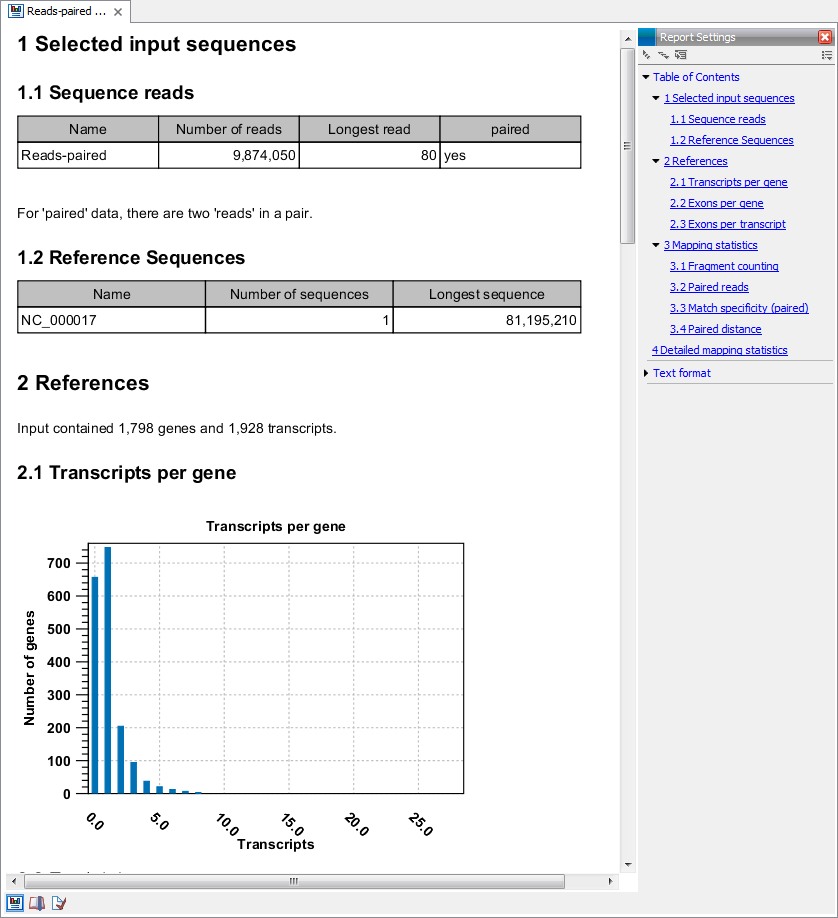
An example of the result of the option Create report is shown in figure 27.10.

Figure 27.10: Report of an RNA-Seq run.
The report contains the following information:
- Sequence reads. Information about the number of reads.
- Reference sequences. Information about the reference sequences used and their lengths.
- Reference. Information about the total number of genes and transcripts (for eukaryotes only) found in the reference.
- Transcripts per gene. A graph showing the number of transcripts per gene. For eukaryotes, this will be equivalent to the number of mRNA annotations per gene annotation.
- Exons per gene. A graph showing the number of exons per gene.
- Exons per transcript. A graph showing the number of exons per transcript.
- Mapping statistics. Shows statistics on:
- Counted fragments. The number of mapped reads. This number is divided into uniquely and non-specifically mapped reads (see the point below on match specificity for details).
- Uncounted fragments. The number of unmapped reads.
- Total fragments. This is the total number of reads used as input.
- Paired reads. (Only included if paired reads are used). Shows the number of reads mapped in pairs, the number of reads in broken pairs and the number of unmapped reads.
- Match specificity. Shows a graph of the number of match positions for the reads. Most reads will be mapped 0 or 1 time, but there will also be reads matching more than once in the reference. This depends on the Maximum number of hits for a read setting in figure 27.4. Note that the number of reads that are mapped 0 times includes both the number of reads that cannot be mapped at all and the number of reads that matches to more than the 'Maximum number of hits for a read' parameter that you set in the second wizard step. If paired reads are used, a separate graph is produced for that part of the data.
- Paired distance. (Only included if paired reads are used). Shows a graph of the distance between mapped reads in pairs.
- Detailed mapping statistics. This table divides the reads into the following categories.
- Exon-exon reads. Reads that overlap two exons as specified in figure 27.13.
- Exon-intron reads. Reads that span both an exon and an intron. If you have many of these reads, it could indicate a low splicing-efficiency or that a number of splice variants are not annotated on your reference.
- Total exon reads. Number of reads that fall entirely within an exon or in an exon-exon junction.
- Total intron reads. Reads that fall entirely within an intron or in the gene's flanking regions.
- Total gene reads. All reads that map to the gene and it's flanking regions. This is the mapped reads number used for calculating RPKM.
 ). When the input data is a combination of paired and single reads, the mapping statistics will be divided into two parts.
