Create Whole Genome Dot Plot
Using Create Whole Genome Dot Plot two genomes can be compared, allowing a quick way to get an initial overview of the similarities between them.
Create Whole Genome Dot Plot works by identifying seeds, i.e., short stretches of nucleotide sequences that are shared between two genomes but not present multiple times on the same genome. The same approach is taken by Create Whole Genome Alignment.
Note: Dot plots created by this tool are fundamentally different than the dot plots created by the Create Dot Plot tool that comes as standard in the CLC Genomics Workbench. The Workbench tool compares all positions between two sequences. In comparison, Create Whole Genome Dot Plot produces less noise, but it may also miss homologous regions if better matches are found in a different region on a genome.
To run Create Whole Genome Dot Plot, go to:
Tools | Whole Genome Alignment (![]() ) | Create Whole Genome Dot Plot (
) | Create Whole Genome Dot Plot (![]() )
)
Once the tool wizard has opened (figure 2.1), choose two or more nucleotide sequences or nucleotide sequence lists. If the input elements are nucleotide sequence lists, each sequence in the list (chromosomes or contigs) is considered to be part of the same genome.
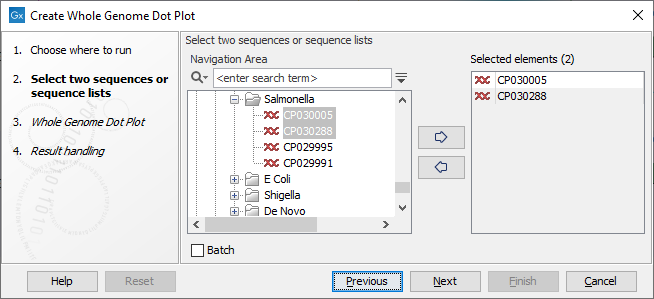
Figure 2.1: Select input for the Create Whole Genome Dot Plot tool.
You can set the following parameters (figure 2.2):
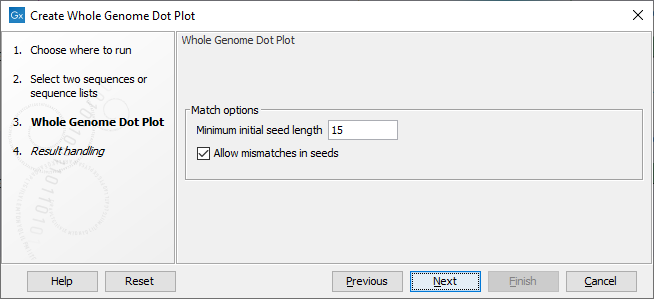
Figure 2.2: Configurable parameters for the Create Whole Genome Dot Plot tool.
- Minimum initial seed length The tool works by identifying seeds - short stretches that are similar - in the two genomes. This option determines the smallest number of nucleotides required before a seed is shown in the dot plot.
- Allow mismatches in seeds When this option is enabled, the search for initial seeds will allow for mismatches in the seeds. This makes it possible to visualize more divergent genome pairs, but may also introduce more noise.
The tool outputs a dot plot (figure 2.3):
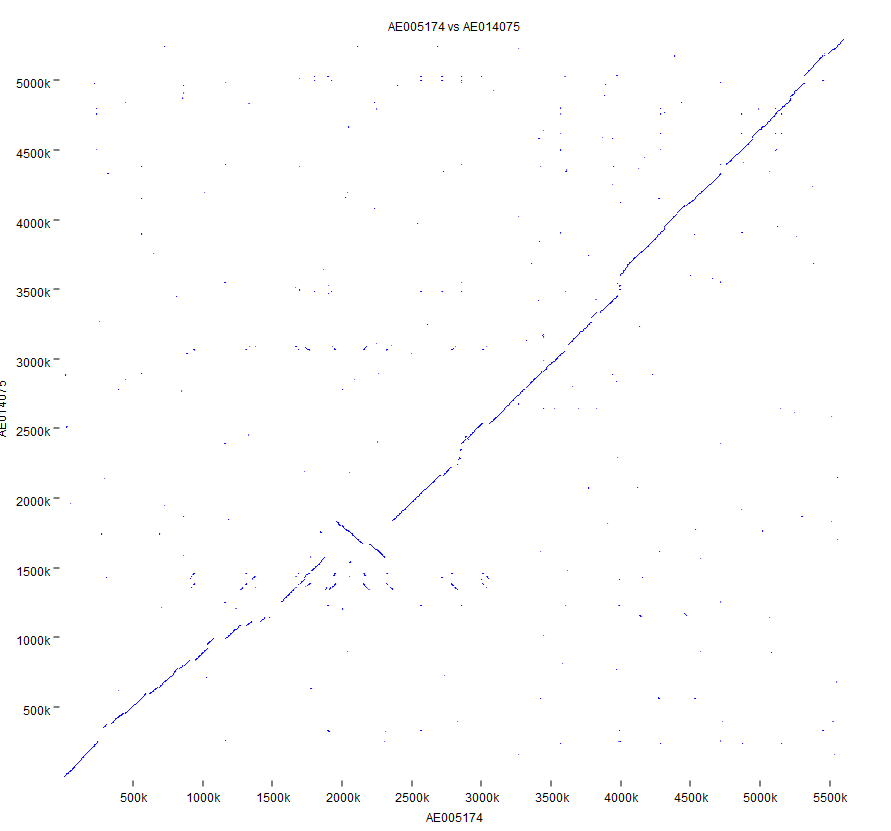
Figure 2.3: Dot plot output from the Create Whole Genome Dot Plot tool.