Create Average Nucleotide Identity Comparison
Create Average Nucleotide Identity Comparison tool is useful for getting a quantitative measure of the similarity between genomes. This tool takes a Whole Genome Alignment as input, and for each pair of genomes, the regions aligned between the two genomes are identified, and the following two measures are calculated:
- The Alignment Percentage is the average percentage of the two genomes which is aligned.
- The Average Nucleotide Identity is the percentage of exactly matching nucleotides for these aligned regions.
It is possible to calculate these measures either for the full set of aligned regions or for a set of regions defined by annotations on the genomes (such as the CDS annotations of protein coding regions).
To run the Create Average Nucleotide Identity Comparison tool, go to:
Tools | Whole Genome Alignment (![]() ) | Create Average Nucleotide Identity Comparison (
) | Create Average Nucleotide Identity Comparison (![]() )
)
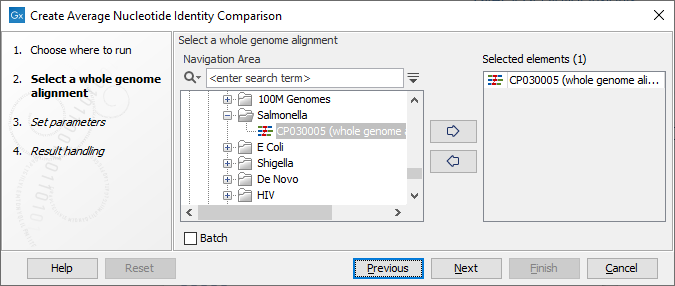
Once the tool wizard has opened (figure 4.1), choose the alignment you would like to analyze.

Figure 4.1: Select a Whole Genome Alignment.
In the next dialog, set the parameters for the tool (figure 4.2).

Figure 4.2: Parameters for the tool, and a view of the annotations that can be specified to restrict the Pairwise Comparison.
Click on the green plus sign to select the Annotations types you wish to restrict your analysis to, as can be seen to the right of figure 4.2. If the tool is restricted to a set of annotations, each annotation must satisfy the Conservation filtering criteria: there must be a minimum required number of identical matches, the Minimum similarity fraction, over at least a specified fraction of the annotation length, the Minimum length fraction. In cases where no annotations are specified, the tool will divide all the aligned regions into smaller regions of 1024 nucleotides. Each of these smaller regions must then satisfy the conservation filtering criteria.
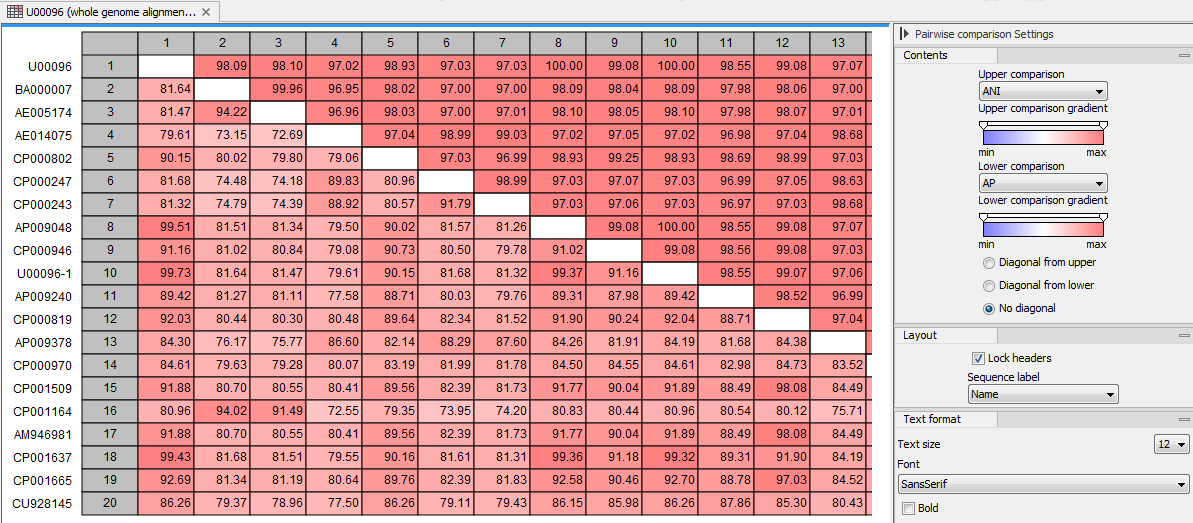
The tool outputs a Pairwise Comparison table as the one seen in figure 4.3.

Figure 4.3: Average Nucleotide Identity Comparison table.
It is possible to export the table using the Pairwise Comparison CSV exporter (see Pairwise Comparison export). It is also possible to input this file in the Create Tree from Comparison and Create Heat Map from Comparison tools for better visualization of the results.
