Create Heat Map from Comparison
Create Heat Map from Comparison builds a heat map from a Pairwise Comparison such as those generated by Create Average Nucleotide Identity Comparison.
To run Create Heat Map from Comparison, go to:
Tools | Whole Genome Alignment (![]() ) | Create Heat Map from Comparison (
) | Create Heat Map from Comparison (![]() )
)
Once the tool wizard has opened (figure 6.1), choose the Pairwise Comparison table you would like to use.
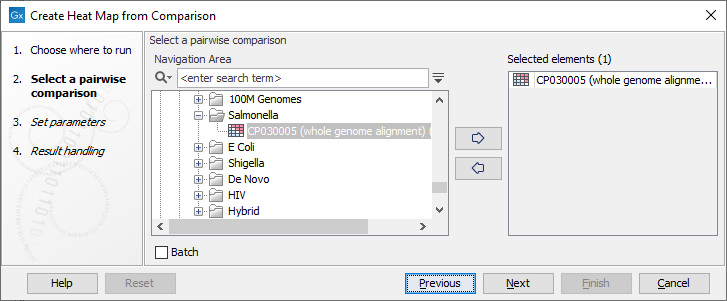
Figure 6.1: Select a Pairwise Comparison table.
In the next dialog (figure 6.2), you can set the following parameters:
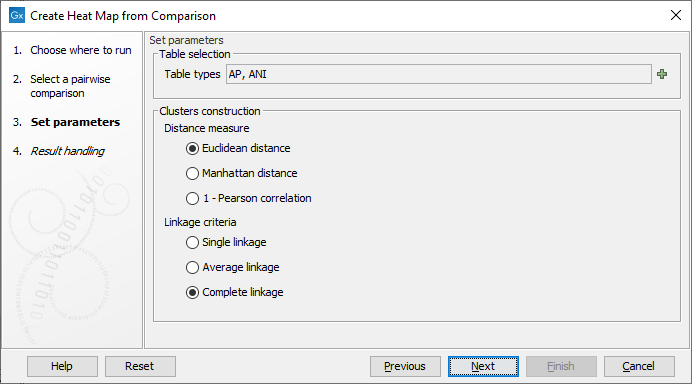
Figure 6.2: Select the table types and clusters construction methods you would like to use for building the heat maps.
- Table types The possible table types are extracted from the Pairwise Comparison table input. In the case of a Pairwise Comparison table obtained from Create Average Nucleotide Identity Comparison, these are: ANI (Average Nucleotide Identity) or AP (Alignment Percentage). If left empty, as it is by default, both types will be used.
- Clusters construction methods
There are three kinds of distance measures:
- Euclidean distance. The length of the segment connecting two points. If
 and
and
 , then the Euclidean distance between
  and
and  is
is
- Manhattan distance. The distance between two points measured along axes at right angles. If
and
, then the Manhattan distance between and is
- 1 - Pearson correlation. The Pearson correlation coefficient between
 and
and
 is defined as
where
is defined as
where
 and
and  are the average and sample standard deviation, respectively, of the values in
  values.
The Pearson correlation coefficient ranges from -1 to 1, with high absolute values indicating strong correlation, and values near 0 suggesting little to no relationship between the elements.
Using 1 - | Pearson correlation | as the distance measure ensures that highly correlated elements have a shorter distance, while elements with low correlation are farther apart.
The distance between two clusters is determined using one of the following linkage types:
- Single linkage. The distance between the two closest elements in the two clusters.
- Average linkage. The average distance between elements in the first cluster and elements in the second cluster.
- Complete linkage. The distance between the two farthest elements in the two clusters.
- Euclidean distance. The length of the segment connecting two points. If
The Pairwise Comparison table input is either a distance or similarity matrix. The tool automatically detects the type of each table by checking the values on the diagonal: if the diagonal contains only zeros, then the table represents a distance matrix, otherwise a similarity matrix. If the table is distance matrix, a similarity matrix s is calculated as follows:
s[i][j] = min + (1 - t[i][j]) * (max - min) if the table is a distance matrix,
where t[i][j] is the relative value (between 0 and 1) found in the table in row i and column j,
and min and max are the minimum and maximum magnitude of the table.
A heat map (figure 6.3) is then created from the similarity matrix s according to the specified clustering options and using a hierarchical clustering algorithm. Note that the tool outputs a heat map for each chosen table type and its name contains the table type used.
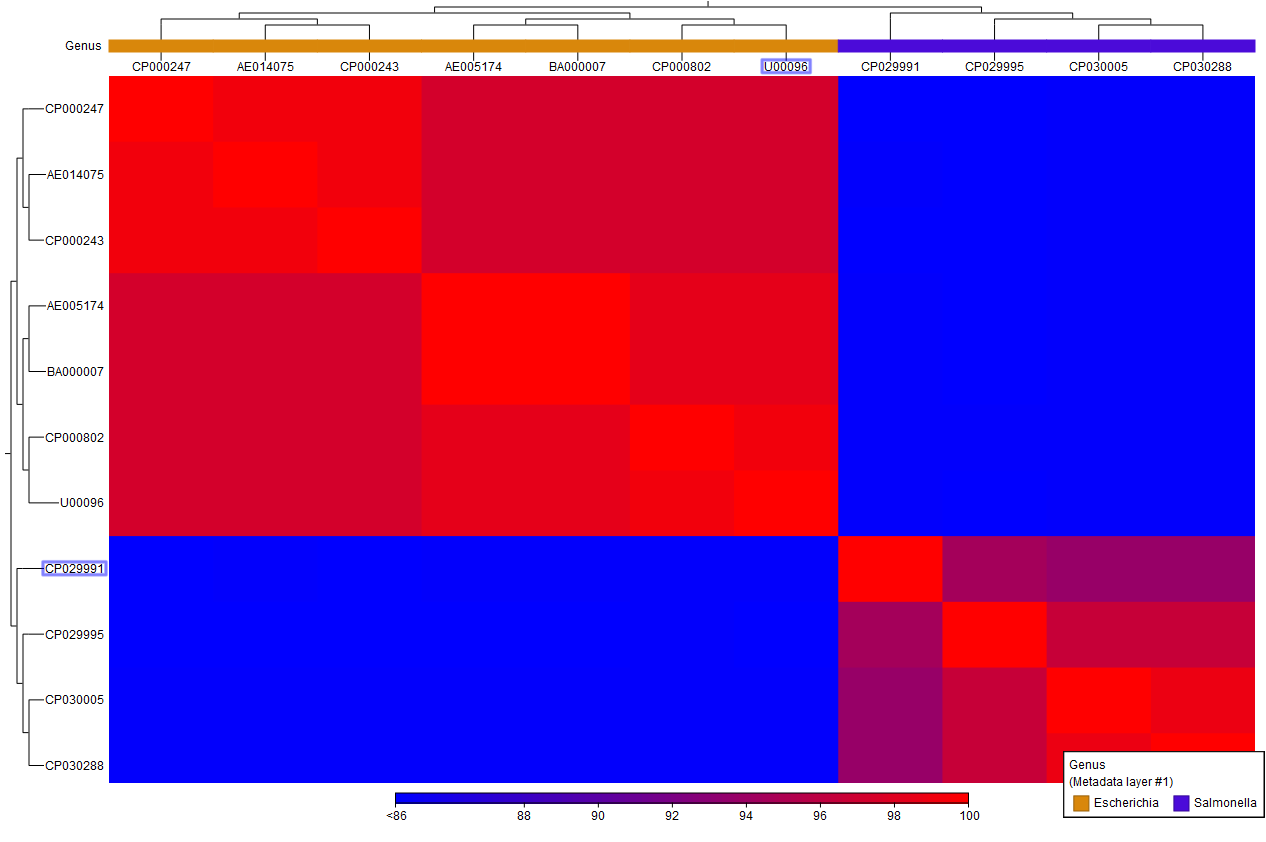
Figure 6.3: A Comparison Heat Map.
Metadata from the Pairwise Comparison is transferred to the map. Additionally, sequence metadata containing taxonomy information is added if this information was present in the inputs. You can learn more about heat map views here: http://resources.qiagenbioinformatics.com/manuals/clcgenomicsworkbench/current/index.php?manual=_heat_map_view.html.