The volcano plot
Statistical comparison tracks also offer a volcano plot view.
An example of a volcano plot is shown in figure 30.70.
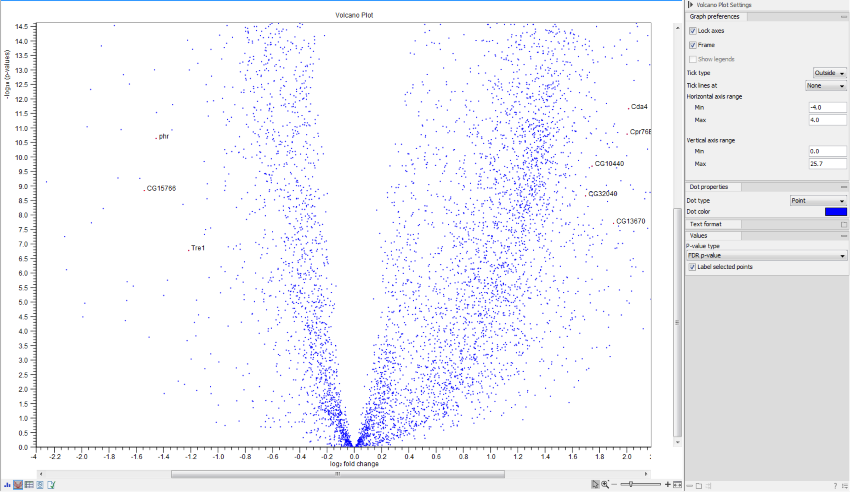
The volcano plot shows the relationship between the p-values of a statistical test and the fold changes among the samples. The log2 fold changes are plotted on the x-axis, and the -log10 p-values are plotted on the y-axis. Features of interest are typically those in the upper left and right hand corners of the volcano plot, as these have large fold changes (lie far from ![]() ) and are statistically significant (have large y-values). It is possible to change the type of p-value from the side panel (see below).
) and are statistically significant (have large y-values). It is possible to change the type of p-value from the side panel (see below).
The view settings can be adjusted using the Side Panel. Under Graph preferences, you can adjust the general properties of the volcano plot
- Lock axes This will always show the axes even though the plot is zoomed to a detailed level.
- Frame Shows a frame around the graph.
- Show legends Shows the data legends.
- Tick type Determine whether tick lines should be shown outside or inside the frame.
- Outside
- Inside
- Tick lines at Choosing Major ticks will show a grid behind the graph.
- None
- Major ticks
- Horizontal axis range Sets the range of the horizontal axis (x axis). Enter a value in Min and Max, and press Enter. This will update the view. If you wait a few seconds without pressing Enter, the view will also be updated.
- Vertical axis range Sets the range of the vertical axis (y axis). Enter a value in Min and Max, and press Enter. This will update the view. If you wait a few seconds without pressing Enter, the view will also be updated.
Below the general preferences, you find the Dot properties and Text format, where you can adjust the coloring and appearance of the dots and text.
At the bottom are options for choosing which values to display:
- P-value type Selects which type of p-value to use.
- Label selected points Chooses whether selected points should be labeled.
Note that if you wish to use the same settings next time you open a volcano plot, you need to save the settings of the Side Panel .