SNP Matrix
The Create SNP Tree tool can optionally output a matrix containing the pairwise number of SNP differences between all pairs of samples included in the analysis (see figure 13.14).
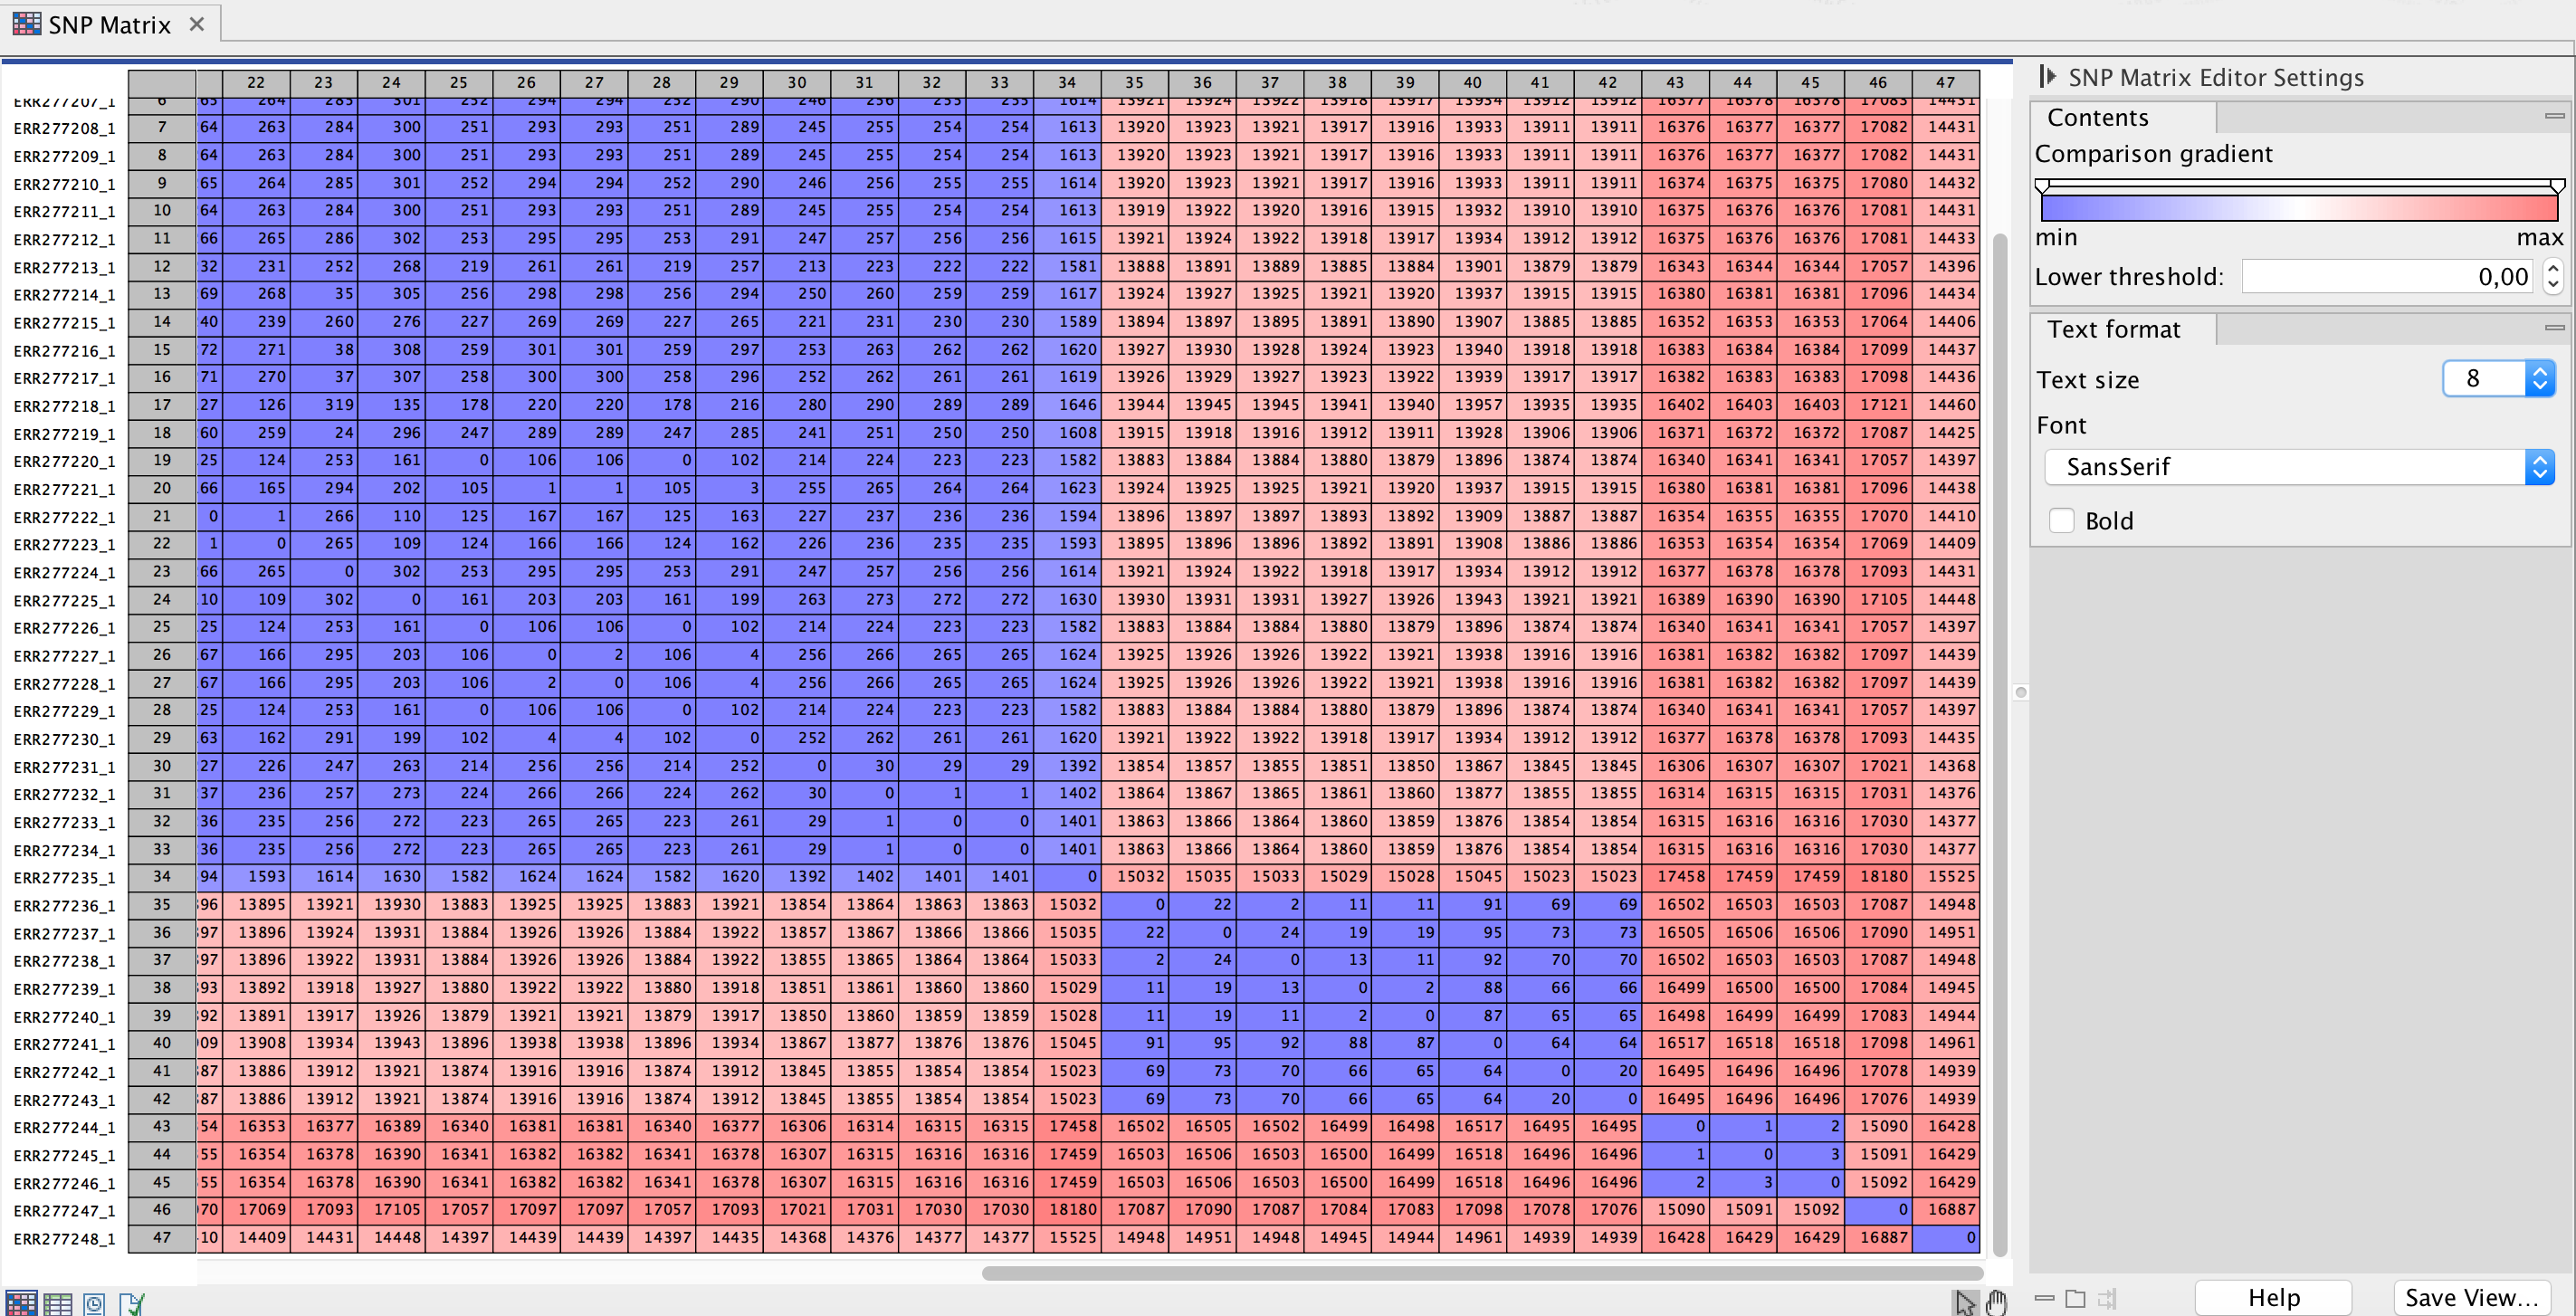
It is possible to easily get an overview of which samples are closely related by using the colored Comparison gradient in the side panel. The minimum and maximum values of the Comparison gradient scale can be adjusted by drag-and-drop such that the colors of the matrix cells change accordingly. Clicking on the Comparison gradients color scale a drop down menu appears where it is possible to select a different color scheme. Finally, it is possible to use the Lower threshold field to type in a lower threshold value between 0 and the maximum value in the matrix. This results in a distinct coloring of the cells in the matrix which have a value less than the threshold. It is possible to export the SNP Matrix to any table format file (*.csv, *.xls, *.xlsx).
Note: it is not possible to import from a *.csv format to a SNP Matrix - rather export the SNP Matrix to a *.clc format and then import it.