Running the "QC for Read Mapping" tool
The tool is found in the Toolbox:
Toolbox | Quality Control (![]() ) | QC for Read Mapping (
) | QC for Read Mapping (![]() )
)
This opens a dialog where you can select mapping results (![]() )/ (
)/ (![]() )/ (
)/ (![]() ) or RNA-Seq analysis results (
) or RNA-Seq analysis results (![]() ).
).
Clicking Next will display the dialog shown in figure 19.11
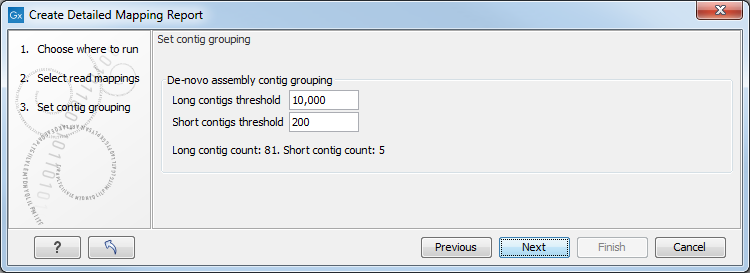
Figure 19.1: Parameters for mapping reports.
The next wizard step shows the used thresholds for the mapping report. These parameters cannot be modified by the user (as thresholds can only be specified for de novo assemblies that do not have a consensus sequence).
Click Next to select output options as shown in figure 19.12
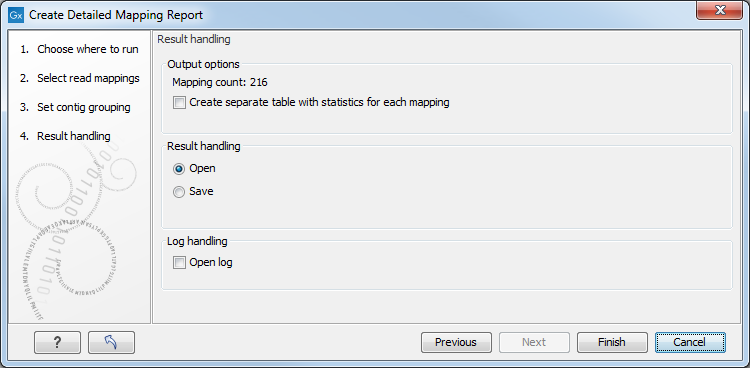
Figure 19.2: Result handling options.
By checking Create table with statistics for each mapping, you can create a table showing detailed statistics for each reference sequence.
The first section of the detailed report is a summary of the statistics: reference count, type, total reference length, GC contents in %, total read count, mean read length, and total read length
- Reference count
- Type
- Total reference length
- GC contents in %
- Total read count
- Mean read length
- Total read length
The rest of the report, as well as the optional statistic tables are described in the following sections.
Subsections