Identify and Annotate Differentially Expressed Genes and Pathways
The Identify and Annotate Differentially Expressed Genes and Pathways compares genes expression in different groups of samples and performs a gene ontology (GO) enrichment analysis on the differentially expressed genes to identify affected pathways. The workflow takes as input Gene Expression (GE) or Transcript Expression (TE) tracks that were generated using the RNA-Seq analysis tool. The samples must be associated to a metadata table.
To run the ready-to-use workflow:
Toolbox | Ready-to-Use Workflows | Whole Transcriptome Sequencing (![]() ) | Human, Mouse or Rat | Identify and Annotate Differentially Expressed Genes and Pathways (
) | Human, Mouse or Rat | Identify and Annotate Differentially Expressed Genes and Pathways (![]() )
)
- Double-click on the Identify and Annotate Differentially Expressed Genes and Pathways ready-to-use workflow to start the analysis. If you are connected to a server, you will first be asked where you would like to run the analysis.
- Next, you will be asked to select the samples to analyze (figure 17.28). You can select several GE tracks or TE tracks generated by the RNA-Seq analysis tool, but not a combination of both. Click Next.
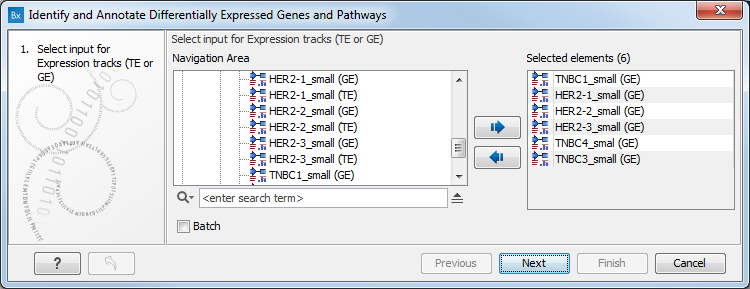
Figure 17.28: Select the GE or TE tracks to analyze. - In the next wizard step you can set up the experimental design associated with the data (figure 17.29):
- Choose the metadata table that was associated to the GE or TE tracks used in the previous step.
- Choose the factor (must be one of the metadata category) that should be used to test for differential expression.
- It is possible to specify confounding factors, i.e., factors that are not of primary interest, but may affect gene expression.
- The Comparisons panel determines the number and type of statistical comparison tracks output by the workflow (see Output of the Differential Expression for RNA-Seq tool for more details).
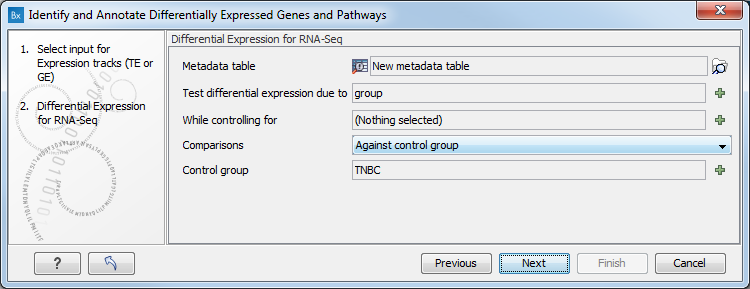
Figure 17.29: Specify the experimental design desired for running the workflow. - In the next step you can choose to preview the settings and save the results (see figure 17.30).
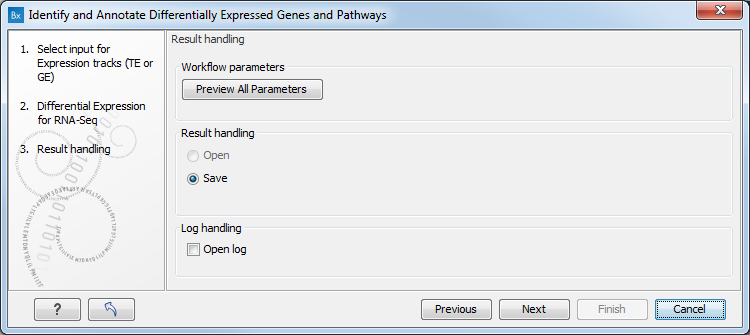
Figure 17.30: The results handling step.Click Finish to start the analysis.
The following outputs are generated:
- PCA for RNA-Seq plot (
 ) Projects a high-dimensional dataset (where the number of dimensions equals the number of genes or transcripts) onto two or three dimensions.
- Statistical Comparison (
 ) The information can be accessed in two different ways:
- Open as a track, hold shift and hover over a feature. A tooltip will appear with information about gene name, results of statistical tests, and expression values.
- Open the track in table format by clicking on the table icon in the lower left side of the View Area.
- Genome Browser View Differentially Expressed Genes and Pathways (
 ) A collection of tracks presented together. Shows the human reference sequence, annotation tracks for genes, coding regions CDS, mRNA, and statistical comparison tracks (see figure 17.31).
- Heat Map for RNA-Seq (
 ) A two dimensional heat map of expression values. Each column corresponds to one sample, and each row corresponds to a feature (a gene or a transcript). The samples and features are both hierarchically clustered.
- Venn Diagram (
 ) To compare the overlap of differentially expressed genes or transcripts in two or more statistical comparison tracks.
- Expression Browser (
 ) To inspect gene and transcript expression level counts and statistics for many samples at the same time.
- GO Enrichment Analysis (
 ) A table showing the results of the GO enrichment analysis. The table includes GO terms, a description of the affected function/pathway, the number of genes in each function/pathway, the number of affected genes within the function/pathway, and p-values.
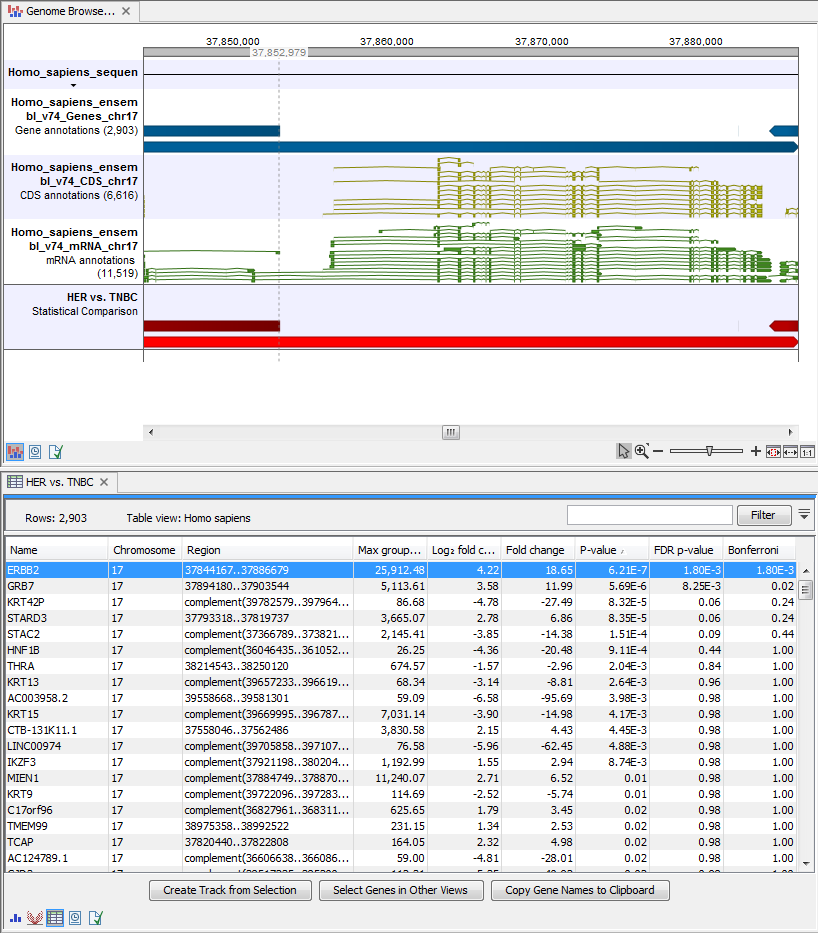
Figure 17.31: The genome browser view allows comparison of the expression comparison tracks with the reference sequence and different annotation tracks.
Please refer to the relevant sections of the the RNA-Seq Analysis tools chapter for additional information on the different output mentioned above.