Viewing Molecule Table structures in 3D
Each row in a Molecule Table contains information about all the 3D atom positions in the molecule, just as when a molecule is imported to a Molecule Project. To see the 3D information, the Molecule Table must be connected to a Molecule Project view. This is done using the "Select View" action found in the Side Panel. This will open the "View in 3D" dialog box shown in figure 9.21.
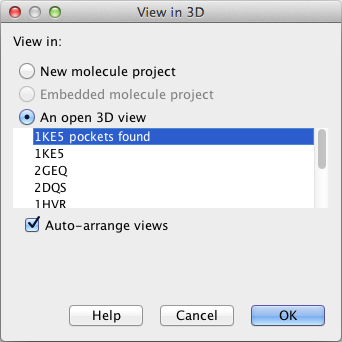
Figure 9.21: The "View in 3D" dialog box.
The following options are available:
- New molecule project will open a new, blank Molecule Project, and show the molecules selected in the table as guests in this project.
- Embedded molecule project is only an option for Docking Results tables (see Viewing Molecule Table structures in 3D), and only if the option to embed the input molecule project in the output table was selected in the Dock Ligands or Screen Ligands wizards (see Protein-ligand docking using the Dock Ligands tool and Screen ligands). The embedded Molecule Project will in that case contain the Binding Site Setup used for the docking.
- An open 3D view will connect the table to one of the Molecule Projects already open in the view area. If no Molecule Projects are currently open, the list will be empty.
If the "Auto-arrange views" option is checked, a split-screen will be arranged with the Molecule Table at the top and the 3D view at the bottom. The entries selected in the Molecule Table will now appear as "guests" in the selected Molecule Project. The visualization of the guest molecules can be changed as for the molecules belonging to the Molecule Project, and they can be hidden by un-checking the boxes next to them (see figure 9.22).
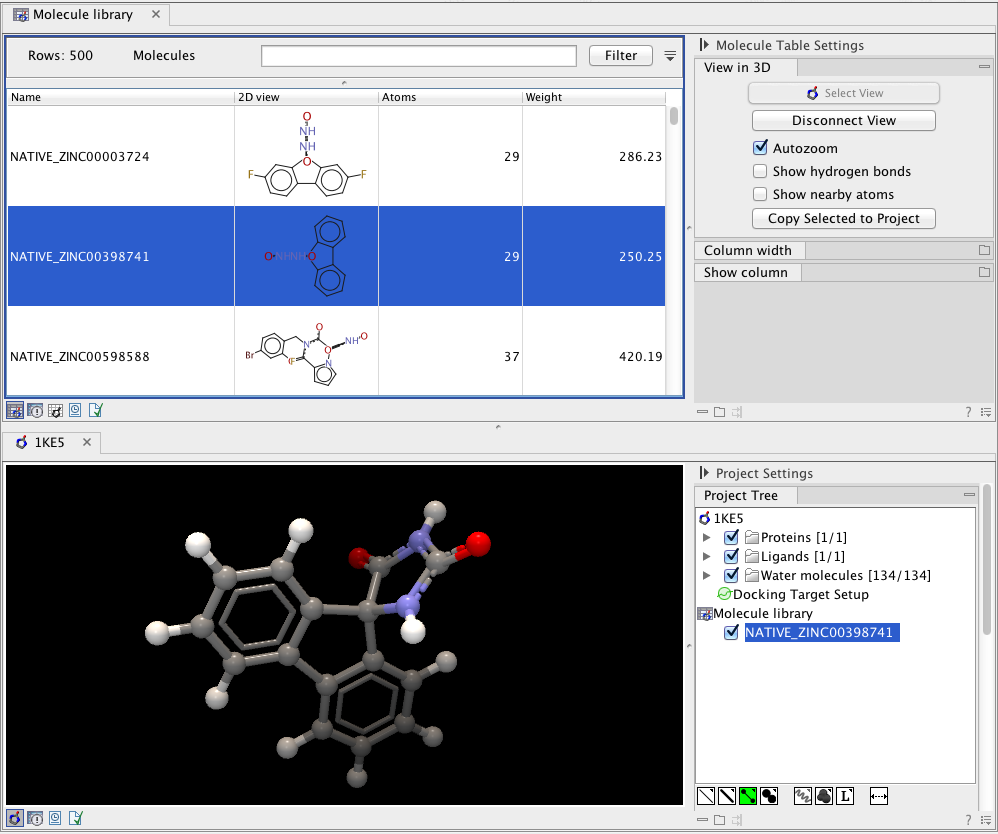
Figure 9.22: A split-screen arrangement with the Molecule Table on top and the 3D view in the bottom.
In the Molecule Table Side Panel, the "View in 3D" category has several options that relates to the behavior of the molecules of the 3D view:
- Auto zoom will zoom in on the molecules that have been selected in the table. This is very handy if you wish to browse through a list of molecules in a table, by using the arrow-keys.
- Show hydrogen bonds will find and display potential hydrogen bond interactions between the molecules selected in the table, and the molecules included in the Binding Site Setup in the connected Molecule Project. If no Binding Site Setup is present, hydrogen bonds to all molecules in all categories except Ligands and Docking Results will be shown.
- Show nearby atoms will display all residues and molecules within 5 Å of the molecule that was selected in the table. If a Binding Site Setup is present, only molecules included in the setup will be shown, otherwise all molecules except for Ligands and Docking Results are shown.
- Copy Selected to Project will copy the molecules selected in the table, to their respective categories in the connected Molecule Project. They can then be saved together with the Molecule Project.
When showing hydrogen bond interactions or the nearby atoms for molecules in a table, the visualization of the interacting atoms will always be in Wireframe, and only the ligand representation will change when another molecule representation is selected for the "guest" molecule. If you wish to customize the visualization of the interacting atoms as well, you should copy the molecule from the Molecule Table to the Molecule Project using the "Copy Selected to Project" action in the Molecule Table Side Panel (Editing molecule objects), and then follow the directions for custom atom group selection of interacting atoms in the section 'How to select a particular group of atoms' in Visualization styles and colors.